DETAILED DESCRIPTION: “A STATISTICAL APPROACH to BETTING THE HORSE RACES” (second edition) provides historical results from over 8,000 races and 23 racetracks. This book will shed new light on handicapping and the probability of winning at the racetrack and Gambling in general. Picking winners frequently does not insure going home a winner. Along with win frequency, bet efficiency must be considered to be a successful track bettor. In the beginning sections of "A Statistical Approach to Betting the Horse Races", simple probability and statistics are discussed to give the reader a basic understanding of how statistics relate to gambling. Other basics such as morning line odds, real time odds, and the para-mutual betting system are explained. Finish position, trifecta, superfecta, and pick-3 statistical results are provided in track by track easy to read hit frequency and efficiency charts. The data is based on the final real time odds with the race favorite being the "A" horse. The next most bet horse is the "B" horse and so on to the last horse in the race. Additionally, the formulas for calculating probabilities using win position data are provided and explained in the text. This guidebook does not pick horses by traditional handicapping methods, but rather looks for those bet combinations that consistently return over time more than the amount wagered. "A Statistical Approach to Betting the Horse Races" can be used alone or as a tool to improve your traditional handicapping methods.

James Ross is a retired Electrical Engineering Graduate
from

The Table of Contents is shown
below. As you can see, the charts are segregated in APPENDIX B by racetrack for
ease of use. In all of the charts and formulas, a letter designation is used to
represent how the horses lined up in the real-time odds. All of the analysis is
based on the real-time odds. The “A” horse is always the real-time favorite.
The “B” horse is the second best horse in the odds and so on to the “E” horse
(5th best). An ABC trifecta bet is the top
three favorites bet in order. A sample is shown for each type of chart.
TABLE OF CONTENTS
FORWARD
INTRODUCTION
STATISTICS AND THIER APPLICATION TO GAMBLING
STATE REGULATIONS FOR CASINOS
BETTING THE
REAL TIME AND MORNING LINE ODDS
CALCULATED PROBABILITIES FOR EXOTIC BETS
EXOTIC BET PROBABILITY EXAMPLES
STATISTICAL PROBABILITY THEORY
COMPARISON OF CALCULATED AND STATISTICAL RESULTS
STATISTICAL RESULTS
POSITION DATA
TRIFECTA STATISTICS AND EFFICIENCIES
SUPERFECTA STATISTICS AND EFFICIENCIES
PICK 3 STATISTICS AND EFFICIENCES
GENERAL CONCLUSIONS
APPENDIX A (FORMULAS REVISITED)
APPENDIX B (CHART DATA BY RACETRACK) pages 65 thru 175
AQUEDUCT CHARTS (position & trifecta)
BAY MEADOWS CHARTS (position, tri, supr, & pick-3)
BEULAH CHARTS (position & trifecta)
CALDER CHARTS (position, tri, supr & pick-3)
CHURCHILL CHARTS (position, trifecta & superfecta)
EVANGELINE CHARTS (position, trifecta & superfecta)
FAIR GROUNDS CHARTS (position, trifecta & superfecta)
GOLDEN GATE CHARTS (position, tri, supr & pick-3)
LONE STAR CHARTS (position, trifecta & superfecta)
MOUNTAINEER CHARTS (position & trifecta)
PENN NATIONAL CHARTS (position, trifecta & superfecta)
RUIDOSO CHARTS (position & trifecta)
SANTA ANITA CHARTS (position, tri, supr & pick-3)
TURF
REFERENCES page 176
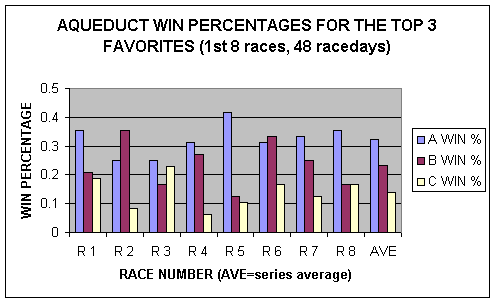
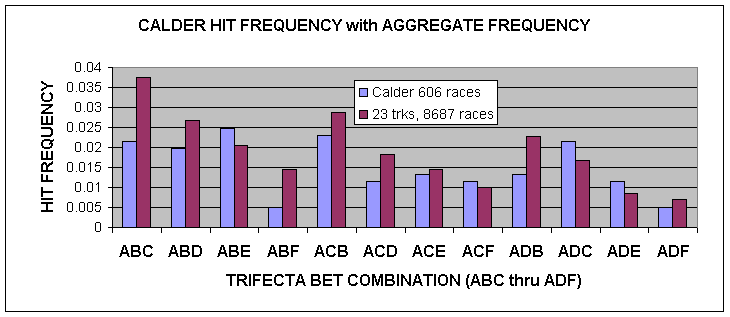
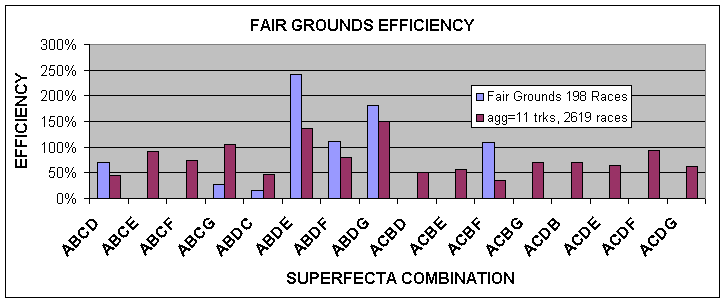
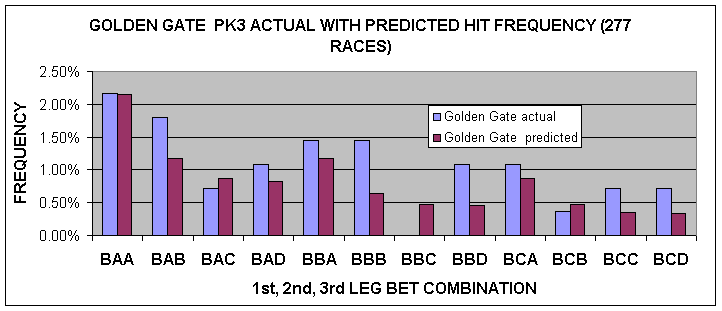
SAMPLE CHARTS FOLLOW: Note: for each racetrack there are two position charts. One provides win, place, and show percentages for the "A" thru "E" horses. The other provides win percentages for the "A thru C" horses for the first eight races in the program. The trifecta and superfecta charts (8 for each) provide frequency and efficiency data. The pick-3 charts (12) also provide frequency and efficiency results. In paperback, charts are grayscale