Mahiar Hamedi
Exercise 3, Kohonens self organized feature map
Definition of the exercise
Write a program in a language of your
choice (Matlab works pretty ok in this case) that simulates Kohonen's
self-organized feature map.
Use your program to study how a 1-d array of units simulates probability
distributions in 2D and 3D. Try some non-constant distributions of your own
choice, and a distribution constant in a rectangle with a variable ratio
between the sides (in 2-d)!
Background to the implementation
The SOM algorithm was implemented in Matlab using the following parameters

where a is the leaning rate,s is the width of the neighbourhood function and N is the number of model vectors
The neighbourhood function h is chosen as Gaussian distribution i.e.

where r is a monotonically increasing function with i and n is the winner index.
Results, constant distribution in a rectangle
The algorithm was tested on a uniform distribution in a rectangle with variable width and height. The number of model vectors N=100 and they where initially also set to random positions in the rectangle.
Figure 1 shows the result for a 2/3 rectangle at different iteration steps. The random points iterate quite fast towards a smooth curve and then gradually converge to a peano curve.
If the height and width of the rectangle are very different the Kohonen curve will converge more towards a line as shown in figure 2 with a
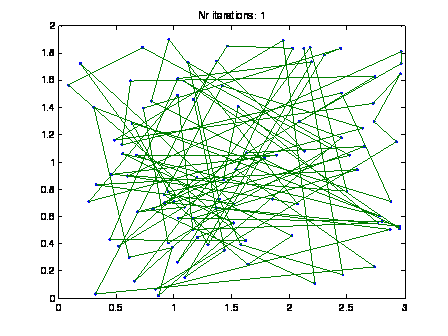
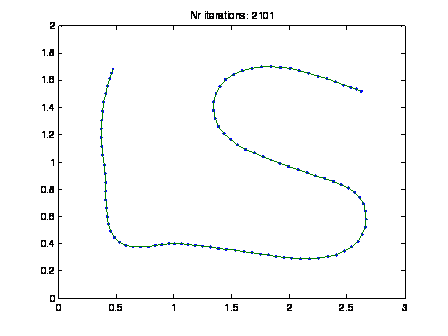
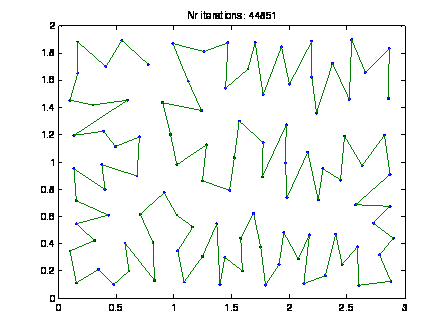
Figure 1. Four iteration steps of a SOM with N=100 and a uniform distribution in a 2/3 rectangle.
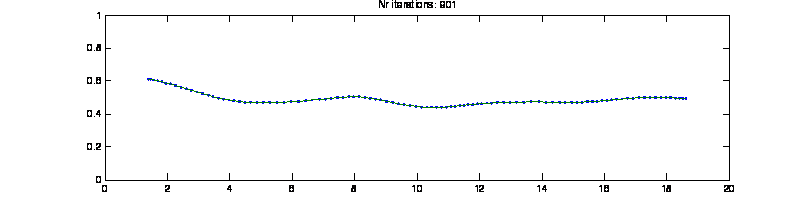
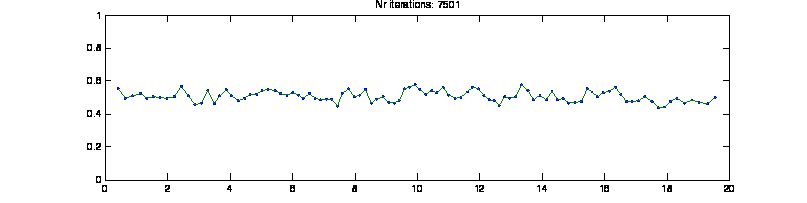
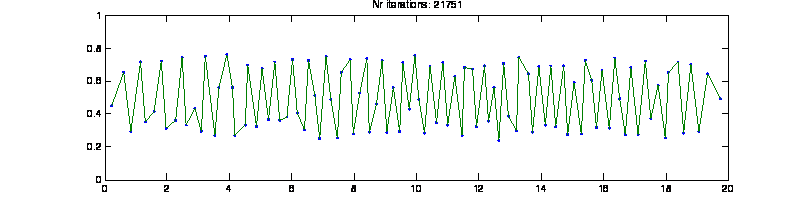
Figure 2. Different iteration steps of a SOM with N=100 and a uniform distribution in a 20/1 rectangle.
Results, variable distribution in a circle
The SOM algorithm was tested on a non uniform distribution in a circle. The start position of the model vectors where again chosen randomly.
Figure 3 shows the result of an iteration. The distribution is more dense in the centre of the circle and thus the net will converge towards more points located in the centre of the circle.
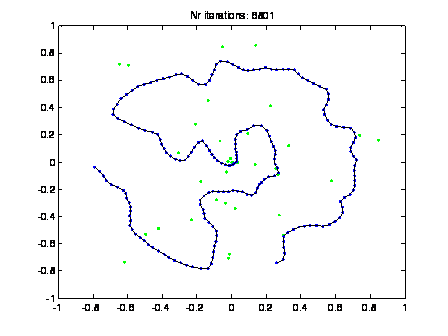
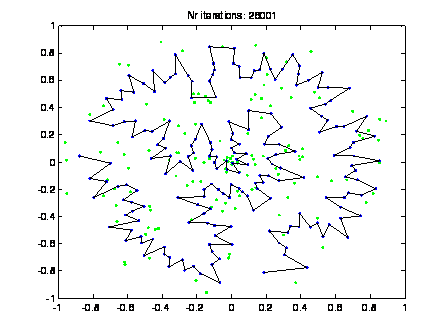
Figure 3. Different iteration steps of a SOM with N=200 and a non-uniform distribution in a circle.
Results, constant distribution in 3d-cube
The algorithm was also tested on a uniform 3d distribution in a cube. Figure 4 shows the results of an iteration, the result is a Peano curve in 3d.
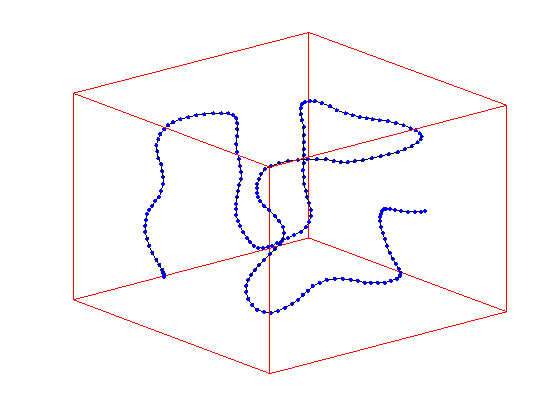
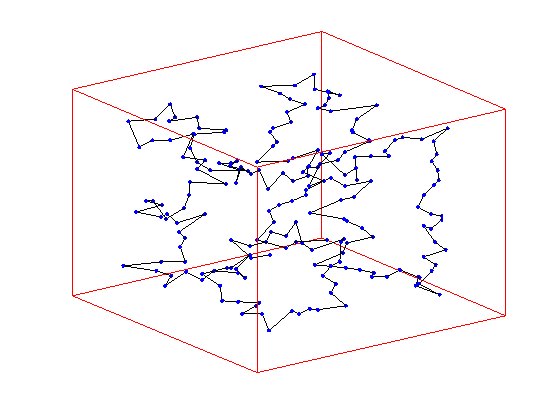
Figure 4. Different iteration steps of a SOM with N=200 and a uniform distribution in a 3d-cube.
The Matlab codes
You can view the matlab codes for the 3 different examples here.
%----------------------------------------------------------------------
% Author: Mahiar Hamedi
% Date: 2002 04 01
% Description: SOM algorithm, constant distribution in a rectangle
%----------------------------------------------------------------------
%--- Variable definition and initialization
clear;
width=3; %height and width of retangle
height=2;
N=100; % Nr points in model vector
M=150; %display data each M:th iteration
m=[rand(N,1)*width rand(N,1)*height]; %inititial constantly random distributed
values for the modelvector
alpha=0; %lerning rate f(t)
sigma=0; %width of neighbourhood function f(t)
%Iteraion loop
for t=0:100000
% calculate alpha(t) and sigma(t)
sigma=N*exp(-t/1000)+0.01;
alpha=0.1*exp(-t/1000)+0.01;
%calculate sample vector and find nearest m
x=ones(1,N)'*[rand*width rand*height];
[d, n]=min(sum((x-m).^2,2)); %d=winner distance, n=index of winner
%calculate gaussian neighbourhood function with monotonical regression
steps
h=exp(-abs([1:N]-n).^2./(2*sigma));
%calculate delta and update m
delta = alpha*[h' h'].*[x-m];
m = m+delta;
%display the model vectors
if mod(t,M)==1
plot(m(:,1),m(:,2),'.',m(:,1),m(:,2),'-');
axis([0 width 0 height])
title(sprintf(' Nr iterations: %u',t))
drawnow;
end
end
%----------------------------------------------------------------------
% Author: Mahiar Hamedi
% Date: 2002 04 01
% Description: SOM algorithm, Variable distribution in a circle
%----------------------------------------------------------------------
%--- Variable definition and initialization
clear;
N=200; % Nr points in model vector
M=200; %display data each M:th iteration
m=[2*rand(N,1)-1 2*rand(N,1)-1]; %inititial constantly random distributed
values for the modelvector
%m=[(1:N)' (1:N)'];
alpha=0; %lerning rate f(t)
sigma=0; %width of neighbourhood function f(t)
i=0;
xd(1,2)=0;
%Iteraion loop
for t=0:100000
% calculate alpha(t) and sigma(t)
sigma=N*exp(-t/1000)+0.01;
alpha=0.1*exp(-t/1000)+0.01;
%calculate sample vector (random distribution in a circle) and find nearest
m
a=rand*2*pi;
r=rand;
x=ones(1,N)'*[r*sin(a) r*cos(a)];
[d, n]=min(sum((x-m).^2,2)); %d=winner distance, n=index of winner
%calculate gaussian neighbourhood function with monotonical regression
steps
h=exp(-abs([1:N]-n).^2./(2*sigma));
%calculate delta and update m
delta = alpha*[h' h'].*[x-m];
m = m+delta;
%display the model vectors
if mod(t,M)==1
i=i+1;
xd(i,:)=x(1,:);
clf;
plot(xd(:,1),xd(:,2),'.g');
hold on;
plot(m(:,1),m(:,2),'.b',m(:,1),m(:,2),'-k');
axis([-1 1 -1 1])
title(sprintf(' Nr iterations: %u',t))
drawnow;
end
end
%----------------------------------------------------------------------
% Author: Mahiar Hamedi
% Date: 2002 04 01
% Description: SOM algorithm, uniform distribution in cube
%----------------------------------------------------------------------
%--- Variable definition and initialization
clear;
N=200; % Nr points in model vector
M=200; %display data each M:th iteration
m=[rand(N,1) rand(N,1) rand(N,1)]; %inititial constantly random distributed
values for the modelvector
alpha=0; %lerning rate f(t)
sigma=0; %width of neighbourhood function f(t)
%Iteraion loop
for t=0:100000
% calculate alpha(t) and sigma(t)
sigma=N*exp(-t/1000)+0.01;
alpha=0.1*exp(-t/1000)+0.01;
%calculate sample vector (random distribution in a circle)
and find nearest m
a=rand*2*pi;
r=rand;
x=ones(1,N)'*[rand rand rand];
[d, n]=min(sum((x-m).^2,2)); %d=winner distance, n=index of winner
%calculate gaussian neighbourhood function with monotonical regression
steps
h=exp(-abs([1:N]-n).^2./(2*sigma));
%calculate delta and update m
delta = alpha*[h' h' h'].*[x-m];
m = m+delta;
%display the model vectors
if mod(t,M)==1
clf;
plot3(m(:,1),m(:,2),m(:,3),'.b',m(:,1),m(:,2),m(:,3),'-k');
hold on;
axis off
plot3([0 1 1 0 0],[0 0 1 1 0],[0 0 0 0 0],'r-');
plot3([0 1 1 0 0], [0 0 1 1 0], [1 1 1 1 1],'r-');
plot3([0 0 1 1 1 1 0 0],[0 0 0 0 1 1 1 1],[0 1 1 0 0 1 1 0],'r-');
view(t/20,20)
title(sprintf(' Nr iterations: %u',t))
drawnow;
end
end