Initial DO reading (mg/L) + Final DO reading (mg/L) = Net DO reading (mg/L)
Net DO reading (mg/L) x Water volume (L) = Absolute O2 (mg)
Absolute O2 (mg) / Time interval (min) = Metabolic Rate (mg O2/min)
| Effect of Salinity Levels on Metabolic Rates of Black Mollies | |||||||||||||||||||||||||||||||||||||||||||||||||||||||||||||||||||||||||||||||||||||||||||||
| Katherine Guthrie | |||||||||||||||||||||||||||||||||||||||||||||||||||||||||||||||||||||||||||||||||||||||||||||
| INTRODUCTION | |||||||||||||||||||||||||||||||||||||||||||||||||||||||||||||||||||||||||||||||||||||||||||||
| Freshwater and saltwater organisms maintain constant internal concentrations of water and solutes by different mechanisms of regulation.� A saltwater environment has a high solute to water ratio making saltwater organisms hypo-osmotic.� This means they tend to absorb solutes and lose water; therefore, they must excrete large amounts of solutes and consume more water (1108 lab manual, 2003).� Freshwater organisms' environments have a smaller solute to water ratio, so they tend to absorb water and lose solutes, making them hyper-osmotic (1108 lab manual, 2003). �Thus, they must produce large amounts of urine and absorb solutes, usually through their gills and intestines, in order to maintain constant internal concentrations of solutes and water (Plaut 1998). | |||||||||||||||||||||||||||||||||||||||||||||||||||||||||||||||||||||||||||||||||||||||||||||
| The metabolic rate of an animal is the amount of energy used for biochemical reactions in a given time interval (Campbell and Reece, 2002).� An important biochemical reaction in animal life is respiration.� During respiration animals use glucose and oxygen to produce carbon dioxide, water, and energy in the form of ATP.� As an animal's body does work, energy is used.� In order to create more energy, more oxygen must be consumed.� It is for this reason that we measure the amount of dissolved oxygen to calculate metabolic rate.� | |||||||||||||||||||||||||||||||||||||||||||||||||||||||||||||||||||||||||||||||||||||||||||||
| In aquatic animals the active transport of solutes against a gradient requires energy; therefore, the metabolic rate of an individual organism increases with the increase of osmotic stress and decreases with the decrease of osmotic stress.� Yet, under extreme osmotic stress, an organism's body cannot handle this change in solute level and shuts down, decreasing its metabolic rate (1108 lab manual, 2003).� | |||||||||||||||||||||||||||||||||||||||||||||||||||||||||||||||||||||||||||||||||||||||||||||
| The subject of our experiment was the black molly, Poecilialatipinna, which lives in both freshwater and saltwater habitats.� It is known that inter-tidal species, such as the black molly, have a larger tolerance for salinity change because the salinity of their environment changes often (1108 lab manual, 2003).� We tested 3 black mollies' metabolic rates as their environmental salinity changed in order to determine whether a change in environmental concentration affects a fish's metabolic rate.� In order to measure the metabolic rates, we measured each fish's oxygen consumption over a distinct time period.� We think that as the environmental solute concentration changes, a trend in the change of metabolic rate will occur. | |||||||||||||||||||||||||||||||||||||||||||||||||||||||||||||||||||||||||||||||||||||||||||||
| MATERIALS AND METHODS | |||||||||||||||||||||||||||||||||||||||||||||||||||||||||||||||||||||||||||||||||||||||||||||
| The black molly specimen were pet-store purchased and kept in freshwater; they were not fed for 24 hr prior to the experiment in order to confirm they were not digesting food while we measured their metabolic rates. | |||||||||||||||||||||||||||||||||||||||||||||||||||||||||||||||||||||||||||||||||||||||||||||
| On 23 March 2003 we obtained 3 black mollies from a freshwater tank.� We began the experiment with Fish 1.� We put Fish 1 in a 250 mL beaker containing water with salinity of 0 parts per trillion (ppt); this beaker served as our holding beaker.� To a 125 mL Erlenmeyer flask we added water with a salinity of 0 ppt.� We added Fish 1 to the flask then secured the dissolved oxygen (DO) meter so that a seal formed between the meter and the opening of the flask.� We wrapped a paper towel around the flask and secured it with tape in order to keep the classroom environment from affecting the fish's level of arousal.� We let the fish acclimate in this environment for 5 min (1108 lab manual, 2003).� We measured the initial DO reading after Fish 1 acclimated and the final DO reading 7 min after the initial DO reading, with the exception of the test with water of salinity of 10 ppt, which ran for 10 min (this difference in method applies only to Fish 1).� After the readings were collected, we poured the contents of the flask through a fish net and into a 250 mL graduated cylinder to measure the volume of water used; in each run the volume of water was 116 mL.� We then returned the fish to the holding beaker and poured the waste water into a 2 L nalgene beaker.� We repeated this process of measuring the change in oxygen concentration for waters of salinities 10 ppt, 20 ppt and 30 ppt.� After the experiment was complete, we returned the fish to a freshwater tank where it would be fed.� We repeated this procedure for Fish 2 and Fish 3. | |||||||||||||||||||||||||||||||||||||||||||||||||||||||||||||||||||||||||||||||||||||||||||||
| The independent variable of this experiment was the salinity of the water while the dependent variable was the metabolic rate of the black molly.� We used no control for this experiment; if one had been used it would have been a DO measurement with no fish present.� | |||||||||||||||||||||||||||||||||||||||||||||||||||||||||||||||||||||||||||||||||||||||||||||
| To determine the metabolic rate we used the following equations (Table 1):� Initial DO reading (mg/L) + Final DO reading (mg/L) = Net DO reading (mg/L) Net DO reading (mg/L) x Water volume (L) = Absolute O2 (mg) Absolute O2 (mg) / Time interval (min) = Metabolic Rate (mg O2/min) |
|||||||||||||||||||||||||||||||||||||||||||||||||||||||||||||||||||||||||||||||||||||||||||||
| An average of the metabolic rates of Fish 1, 2, and 3 was calculated (Table 2). | |||||||||||||||||||||||||||||||||||||||||||||||||||||||||||||||||||||||||||||||||||||||||||||
| RESULTS | |||||||||||||||||||||||||||||||||||||||||||||||||||||||||||||||||||||||||||||||||||||||||||||
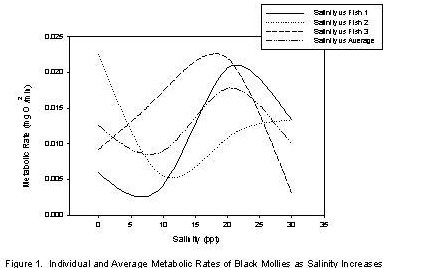
| The metabolic rates of Fish 1 and 2 and the average metabolic rate decreased from salinity 0 ppt to 10 ppt, while the metabolic rate of Fish 3 increased.� The metabolic rate of all fish and the average metabolic rate increased from salinity 10 ppt to 20 ppt.� The metabolic rate of Fish 1 and 3 and the average metabolic rate decreased from salinity 20 ppt to 30 ppt, while the metabolic rate of Fish 2 increased (Table 2 and Figure 1). | |||||||||||||||||||||||||||||||||||||||||||||||||||||||||||||||||||||||||||||||||||||||||||||
| Table 1.� Measurement of Black Mollie Metabolic Rates as Salinity Increases for Fish 3 | |||||||||||||||||||||||||||||||||||||||||||||||||||||||||||||||||||||||||||||||||||||||||||||
| Metabolic Rate (mg O2/min) | |||||||||||||||||||||||||||||||||||||||||||||||||||||||||||||||||||||||||||||||||||||||||||||
| Salinity (ppt) | Initial DO reading | Final DO reading (mg/L) | Net DO reading (mg/L) | Water volume | |||||||||||||||||||||||||||||||||||||||||||||||||||||||||||||||||||||||||||||||||||||||||
| Absolute O2 (mg) | |||||||||||||||||||||||||||||||||||||||||||||||||||||||||||||||||||||||||||||||||||||||||||||
| (mg/L) | (L) | ||||||||||||||||||||||||||||||||||||||||||||||||||||||||||||||||||||||||||||||||||||||||||||
| 0 | 5.25 | 3.89 | 1.36 | .116 | .158 | .0225 | |||||||||||||||||||||||||||||||||||||||||||||||||||||||||||||||||||||||||||||||||||||||
| 10 | 5.68 | 5.21 | .47 | .116 | .0545 | .00545 | |||||||||||||||||||||||||||||||||||||||||||||||||||||||||||||||||||||||||||||||||||||||
| 20 | 6.97 | 6.32 | .65 | .116 | .0754 | .0108 | |||||||||||||||||||||||||||||||||||||||||||||||||||||||||||||||||||||||||||||||||||||||
| 30 | 5.94 | 5.14 | .80 | .116 | .0928 | .0133 | |||||||||||||||||||||||||||||||||||||||||||||||||||||||||||||||||||||||||||||||||||||||
| Table 2.� Average and Individual Metabolic Rates of �Black Mollies as Salinity Increases | |||||||||||||||||||||||||||||||||||||||||||||||||||||||||||||||||||||||||||||||||||||||||||||
| Metabolic | Rates (mg O2/min) | ||||||||||||||||||||||||||||||||||||||||||||||||||||||||||||||||||||||||||||||||||||||||||||
| Salinity | Fish 1 | Fish 2 | Fish 3 | Average Metabolic Rate (mg O2/min) | |||||||||||||||||||||||||||||||||||||||||||||||||||||||||||||||||||||||||||||||||||||||||
| (ppt) | |||||||||||||||||||||||||||||||||||||||||||||||||||||||||||||||||||||||||||||||||||||||||||||
| 0 | 0.00593 | 0.0225 | 0.00922 | 0.01255 | |||||||||||||||||||||||||||||||||||||||||||||||||||||||||||||||||||||||||||||||||||||||||
| 10 | 0.00416 | 0.00545 | 0.0173 | 0.00897 | |||||||||||||||||||||||||||||||||||||||||||||||||||||||||||||||||||||||||||||||||||||||||
| 20 | 0.0206 | 0.0108 | 0.022 | 0.0178 | |||||||||||||||||||||||||||||||||||||||||||||||||||||||||||||||||||||||||||||||||||||||||
| 30 | 0.0133 | 0.0133 | 0.00307 | 0.00989 | |||||||||||||||||||||||||||||||||||||||||||||||||||||||||||||||||||||||||||||||||||||||||
|
|||||||||||||||||||||||||||||||||||||||||||||||||||||||||||||||||||||||||||||||||||||||||||||
| DISCUSSION | |||||||||||||||||||||||||||||||||||||||||||||||||||||||||||||||||||||||||||||||||||||||||||||
| The average fish data exemplified the existence of a trend in the metabolic rate as salinity changed.� The existence of this trend disproves our null hypothesis and supports our hypothesis.� | |||||||||||||||||||||||||||||||||||||||||||||||||||||||||||||||||||||||||||||||||||||||||||||
| At a salinity of 0 ppt to approximately 8 ppt, metabolic rate decreased.� Between these salinities, the concentration of solutes outside the fish (con(solOF)) is less than the concentration of solutes inside the fish (con(solIF)).� This implies that solutes are moving out of the fish and water is moving into the fish.� Therefore the fish must work to make these concentrations equal; it does this by absorbing solutes and excreting dilute urine.� When the con(solIF) equals con(solOF) the metabolic rate of the fish is neither increasing nor decreasing, which is the case at approximately 8 ppt. | |||||||||||||||||||||||||||||||||||||||||||||||||||||||||||||||||||||||||||||||||||||||||||||
| At a salinity of 10 ppt to 20 ppt, the average metabolic rate increased.� At the point when metabolic rate begins to increase, the con(solOF) is greater than con(solIF) so the fish must drink more water and secrete urine with a high concentration of solutes.� As the con(solOF) increases, the fish must do more work to keep the con(solOF) equal to the con(solIF); this increase in amount of work is represented by the increase in metabolic rate. | |||||||||||||||||||||||||||||||||||||||||||||||||||||||||||||||||||||||||||||||||||||||||||||
| At a salinity of approximately 21 ppt to 30 ppt, the average metabolic rate decreased.� The salinity of 21 ppt represents the average fish's threshold salinity.� The threshold salinity is the point at which the fish is no longer able to maintain the equality of the con(solOF) and the con(solIF).� At this point the fish's system shuts down, thus decreasing its metabolic rate. | |||||||||||||||||||||||||||||||||||||||||||||||||||||||||||||||||||||||||||||||||||||||||||||
| Plaut (1998) found that Salariafluviatilis, which inhabits freshwater habitats, tolerated salinities of 0, 40 and 100% seawater (0, 14.4 and 36 ppt sea salt respectively).� These results indicate that S. fluviatilis is able to osmoregulate both in fresh and seawater (Plaut 1998).� Our average data demonstrate that the black molly does not tolerate salinities greater than approximately 21 ppt which means the black molly cannot osmoregulate in as great a range as the S. flauviatilis.� | |||||||||||||||||||||||||||||||||||||||||||||||||||||||||||||||||||||||||||||||||||||||||||||
| One source of error in this experiment, which could have contributed to the conflicting data among the 3 fish, was the inconsistent testing environment.� Movement and sound around the fishes could affect their activity and cause their metabolic rates to increase.� We tried to remedy this problem by covering our flask with a paper towel, but the noise level was still a problem.� | |||||||||||||||||||||||||||||||||||||||||||||||||||||||||||||||||||||||||||||||||||||||||||||
| One means of changing the method design in order to decrease error would be to use fish that are more common in size and sex.� Differences in these factors can contribute to differences in metabolic rate that are not related to changes in salinity. | |||||||||||||||||||||||||||||||||||||||||||||||||||||||||||||||||||||||||||||||||||||||||||||
| The study of changes in the salinity of fish does not apply only to measuring metabolic rates.� McManus and Travis (1998) used different salinity systems to measure their affects on body mass.� They found that different salinity regimes (2, 12, or 20 parts per thousand) did not affect body mass.� However, as metabolic rate increases to maintain constant internal concentrations of water and solutes, more glucose and oxygen are being used.� Therefore, changes in salinity have an affect on the body mass of fish.� The implications of this may be found in the fish retail industry.� In order for fish to have a large body mass they must use less glucose than they intake.� Therefore, keeping fish at their optimal salinities, will allow this to occur because they are using less energy and, therefore, are consuming less glucose.� | |||||||||||||||||||||||||||||||||||||||||||||||||||||||||||||||||||||||||||||||||||||||||||||
| Further research on changes in metabolic rates due to salinity changes may be possible to study the affect of sex on metabolic rate as salinity changes.� This could be important in decreasing the error in experiments which test the changes in metabolic rates of fish due to salinity. | |||||||||||||||||||||||||||||||||||||||||||||||||||||||||||||||||||||||||||||||||||||||||||||
| REFERENCES | |||||||||||||||||||||||||||||||||||||||||||||||||||||||||||||||||||||||||||||||||||||||||||||
| 1108 lab manual.� 2003.� Effects of Salinity on Metabolic Rate in Black Mollies.� Pp. | |||||||||||||||||||||||||||||||||||||||||||||||||||||||||||||||||||||||||||||||||||||||||||||
| ����������� 14.1-14.2, 14.4-14.5.� Contemporary Publishing Company of Raleigh, Inc., | |||||||||||||||||||||||||||||||||||||||||||||||||||||||||||||||||||||||||||||||||||||||||||||
| ����������� Raleigh. | |||||||||||||||||||||||||||||||||||||||||||||||||||||||||||||||||||||||||||||||||||||||||||||
| Campbell, N.A., J.B. Reece.� 2002.� Metabolic rate provides clues to an animal's | |||||||||||||||||||||||||||||||||||||||||||||||||||||||||||||||||||||||||||||||||||||||||||||
| bioenergetic "strategy." Pp. 844.� Pearson Education, Inc., San Francisco. | |||||||||||||||||||||||||||||||||||||||||||||||||||||||||||||||||||||||||||||||||||||||||||||
| McManus, M.G., J. Travis.� 1998.� Effects of temperature and salinity on | |||||||||||||||||||||||||||||||||||||||||||||||||||||||||||||||||||||||||||||||||||||||||||||
| the life history of the sailfin molly (Pisces: Poeciliidae): lipid storage and | |||||||||||||||||||||||||||||||||||||||||||||||||||||||||||||||||||||||||||||||||||||||||||||
| reproductive allocation.� Oecologia 114:� 317-325. | |||||||||||||||||||||||||||||||||||||||||||||||||||||||||||||||||||||||||||||||||||||||||||||
| Plaut, I.� 1998.� Comparison of salinity tolerance and osmoregulation in two closely | |||||||||||||||||||||||||||||||||||||||||||||||||||||||||||||||||||||||||||||||||||||||||||||
| related species of blennies from different habitats. Fish Physiology and | |||||||||||||||||||||||||||||||||||||||||||||||||||||||||||||||||||||||||||||||||||||||||||||
| Biochemistry 19: 181-188. | |||||||||||||||||||||||||||||||||||||||||||||||||||||||||||||||||||||||||||||||||||||||||||||
| Home Links What I Learned Today Readings Books My Email | |||||||||||||||||||||||||||||||||||||||||||||||||||||||||||||||||||||||||||||||||||||||||||||