Internet-based
evaluation of tourism Web site effectiveness: Methodological issues and survey
results
Journal of Travel Research;
Boulder; Nov 2000; Patrick Tierney;
|
Volume: |
39 |
|
Issue: |
2 |
|
Start Page: |
212-219 |
|
ISSN: |
00472875 |
|
Geographic Names: |
United States |
Abstract:
There is a growing
reliance on the Internet and Web sites for promotion of tourism.
Evaluation of Web site effectiveness is necessary because of significant costs
for setup, advertising, and maintenance. Research suggests there is a great need
for evaluations to go beyond hits and page viewings. The objectives of a study
were to develop and apply a low-cost, automated, Internet-based survey
methodology to investigate effectiveness of a tourism promotional Web
site. Both online and email surveys were used to gather data from visitors to a
state Web site. Although responses were received from 833 persons, response
rates were low. A check for nonresponsive bias indicated that respondents were
different from nonrespondents. Respondents primarily learned about the Web site
through two sources and reported that the Web site significantly influenced
their travel plans.
[Headnote]
There is growing reliance on
the Internet and Web sites for promotion of tourism. Evaluation of Web site
effectiveness is necessary because of the significant costs for setup,
advertising, and maintenance. Research suggests there is a great need for
evaluations to go beyond hits and page viewings. The objectives of this study
were to develop and apply a low-cost, automated, Internet-based survey
methodology to investigate effectiveness of a tourism promotional Web site. Both
online and email surveys were used to gather data from visitors to a state Web
site. Although responses were received from 833 persons, response rates were
low. A check for nonresponse bias indicated that respondents were different from
nonrespondents. Respondents primarily learned about the Web site through two
sources and reported that the Web site significantly influenced their travel
plans. However, study findings suggest that there are substantial methodological
challenges in conducting Web-based surveys. Suggestions to improve evaluation
methods are provided.
The trend is clear;
there is growing reliance on the Internet for the promotion and sales of tourism
and most products and services. Almost all companies and tourism promotional
organizations now have Web sites. Sales over the Internet doubled from 1998 to
$7 billion during the 1999 Christmas Holiday period (Jupiter Communications,
2000). Online revenues from travel sales are projected to increase 440% between
1997 and 2000, with travel being one of the more frequent services purchased on
the Internet (Tourism Industries of America 1999). A 1999 survey of state
tourism offices found that in the United States, all of the states had a tourism
promotional Web site (Tourism Industries of America 1999).
Evaluation of Web site
effectiveness is necessary because there are significant costs involved in setup
and maintenance of Web sites ($180,000/year according to the Association of
National Advertisers 1999), intense competition for Web viewers, and increasing
costs for advertising to direct potential buyers to a Web site. Although direct
online e-commerce sales are one good indicator of effectiveness, many tourism
Web sites do not directly sell services and cannot use this as a gauge. Tourism
companies that sell complex products, such as tours, have noted that visitors
often only gather information from a Web site and then call or write to request
a brochure or make a reservation. In this case, the Web site may have had a
powerful role in the purchase decision, but the sale itself did not take place
over the Internet. Therefore, additional research is needed to fully determine
Web site effectiveness in promoting tourism services.
The shift to promotion
of tourist products and services through the Internet provides new opportunities
and challenges for researchers desiring to evaluate the effectiveness of Web
sites, compared to traditional media. The nature of the Internet allows Web site
managers to quickly learn the number of hits, visitors to the Web site, and
advertisements. However, knowing the number of viewers of a Web page tells
little about visitor characteristics, motives for visiting the site,
satisfaction with the site, and actions he or she will take as a result of
viewing the Web site. This urgent need to go beyond hits or page viewings in Web
site evaluation is echoed by Forrester Research (1999).
In addition to
traditional phone and written surveys, online or real-time surveys have been
applied to tourism analysis. But as Schonland and Williams (1996) found in the
1995 Net Travelers Survey, there are unique issues and concerns with online
surveys, compared to traditional approaches.
STUDY PURPOSE
The objectives of this
study were to develop and apply a low-cost, automated, Internet-based survey
methodology and to use it to investigate the effectiveness of a tourism
promotional Web site. The official Web site of the California Division of
Tourism (CalTour) located at http://www gocalif.ca.gov
was used in this study
because it is a comprehensive site, heavily visited, and the state was
interested in documenting the effectiveness of this form of promotion. The Web
site has content and images about activities and things to do, travel regions
and cities, sightseeing, maps, insider tips, lodging, restaurants, and shopping,
but at this time, it did not sell products online.
BACKGROUND
Published research into
the effectiveness of tourism Web sites is still very limited. Tourism Industries
of America (1997) conducted a telephone survey of Internet users and found that
in 1997, American adults most frequently used the Internet to gather information
on things to do (31%), where to go (27%), and for schedules (27%), but only 17%
actually made a reservation via the Web.
Schonland and Williams
(1996) were one of the first studies to employ Web-based survey techniques to
evaluate use of the Internet for travel services. The survey used sponsor
incentives and contained questions on travel patterns, destinations, airlines
used, Internet use, and online buying. Researchers were able to acquire a large
sample size (17,700) over a 12-month period, but they found a profound response
bias in their data based on incentives used.
The Tourism Industry of
America (1999) conducted a mail survey to assess technology utilization by state
tourism agencies in the United States. In 1999, all states had a tourism Web
site, and the average state Web site received more than 190,000 hits and
slightly fewer than 19,000 user sessions per week. The most common approaches to
measure effectiveness of state Web sites were number of hits (71 %), number of
user sessions (69%), and online feedback from site visitors (67%). Findings
showed the heavy reliance on state Web site effectiveness determination by
simple monitoring of hits and user-session statistics.
A recent study on the
effectiveness of the state tourism Web site was conducted by the Arkansas
Department of Parks and Tourism in 1999 (McLemore and Mitchell 2000).
Determining if persons inquiring for information via the Web actually visited
the destination was a primary goal of this research. It employed an online
conversion survey asking respondents if they visited the state after requesting
information (68% had visited), how they learned about the state Web site (58.4%
via a link from another Web site), trip duration and expenditures, and future
plans to visit the state (90% had plans in next 12 months). The sample consisted
of persons who had inquired for information via the state Web site. No
information was gathered on visitors to the site who did not request
information. Inquirers were emailed an invitation to complete the online survey
and, therefore, needed to click on to the provided link or visit the survey site
later. Using this approach, the study achieved a 32.2% response rate. Authors
found that this online method was very cost effective in providing current
market information in a very quick turnaround time, compared to conventional
survey methods. Limitations of this approach for measuring effectiveness were no
identification of the impact of nonresponse bias on findings and the sample
being restricted to persons who inquired for information.
As the 1999 Tourism
Industries of America study showed, the most common statistic used to measure
Web site effectiveness is the number of hits to the site. The term hits is
commonly defined as the number of files that are downloaded from a Web server
(host computer). Tracking hits as a way of measuring traffic can be misleading.
The number of hits a site receives is usually much greater than the number of
actual visitors because a Web page usually contains more than one file. More
reliable is the statistic called "user sessions," defined as "a
session of activity (all hits) for one user of a Web site" (WebTrends,
2000). Web traffic software, such as WebTrends (see http://www.webtrends.com),
can provide information on site visitors' domain name and type, region or
country of request, organization type (com, net, org, etc.) ad viewings
(clicks), and time of view. However, this type of software cannot give critical
information about the user, such as income, reason for visiting the site,
satisfaction with the site, or actions taken because of viewing the Web site.
Clearly, to fully understand the impact of a Web site, more information than
just the number of hits or user sessions is needed.
It is possible for host
computers to use coded messages sent to and stored in the viewers browser,
called "cookies," to identify if a browser has visited a Web site
previously and track respondent preferences and page viewings. But cookies
cannot identify users, and sophisticated users simply turn off the cookies
option in their browser.
The ways in which
detailed data are collected about the promotional effectiveness of Web sites can
be quite different from traditional approaches. One approach is to email a
survey to respondents and they reply by emailing it back. Email surveys require
that respondent addresses are known in advance, and this may not be possible.
Online or Web-based
data collection surveys are growing in popularity. These surveys are placed on a
Web page, and respondents react interactively with the survey. It is common to
program automated skips to make it much quicker for the respondent to read and
respond to a complex multipage survey. Color images and the full color and
format options of the Web are available. Respondents usually access the online
survey by a link to it in an email message, or on a Web page.
Recent studies have
documented a large decline in clickthrough rates from ads on a Web site to an
advertiser's site, dropping from 2% to 0.5% in a few years (Neilson 1999). This
suggests that it may be increasingly difficult to get potential Web
"surfers" to become survey respondents. Since the respondent must
click on the link to find an online survey, an incentive is often necessary to
get the user to do so. Incentives are also needed with email surveys because of
the difficulty in getting the attention and cooperation of persons who receive
numerous emails each day, many of which are unsolicited and quickly deleted. Use
of incentives with Internet surveys has been shown to cause at least three
methodological concerns: response bias, multiple entry, and unwanted entries.
Schonland and Williams (1996) found that when they changed incentives, survey
responses and types of respondents changed. It is also possible for one
respondent to enter incentive contests more than once to increase their chances
of winning. Schonland and Williams found that approximately 8% of respondents to
the Net Traveler Survey entered more than once. A final concern is unwanted
entries caused by contest sites on the Web. Contest sites search the Web for
contests and inform their visitors about the prizes and provide a link to them.
Probably one of the
most serious concerns about Internetbased surveys is nonresponse bias. Email and
online surveys, like traditional survey methods, can only gather data about
respondents who choose to participate. But what is unique is the potentially
very low response rates of Internet-based surveys and the difficulty in knowing
any information about nonrespondents (Schonland and Williams 1996). This is a
concem if nonrespondents differed significantly from respondents.
Nonresponse bias in
tourism effectiveness studies has also been shown to be related to the tendency
for respondents to be more likely to visit the destination, compared to
nonrespondents (Ellerbrock 1981; Burke and Gitelson 1990). Low response rates in
Internet-based surveys may exacerbate this problem, compared to traditional
survey methods.
Online surveys have a
potential advantage in the ability to acquire large sample sizes at a very low
cost and in a short time. This is due to the automation of data gathering, and
entry and compilation of data into descriptive statistics. Internet survey
software is available and takes the written survey and converts it into email or
Web-compatible formats, emails or administers online surveys, and then
automatically collects responses, enters them into a database, and calculates
descriptive statistics. Using this software on a busy Web site, it is possible
to collect hundreds of responses in a short period.
A key question for
Internet-based survey methodology is if problems of sample validity, due to low
response rates, are mitigated by the large number of completed surveys that are
possible to acquire. It appears that no published tourism studies have been able
to answer this question for Internet-based surveys, but it seems very important
to do so.
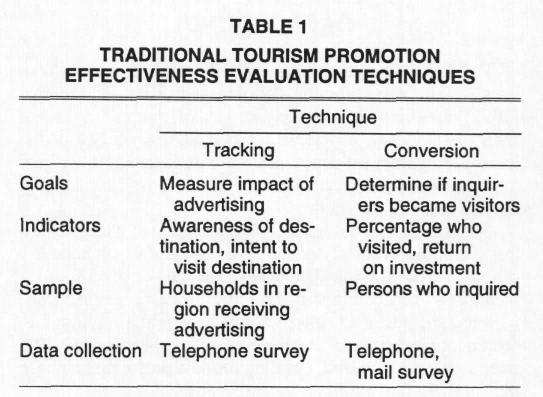
Two traditional
approaches have been developed for the evaluation of tourism media promotion
effectiveness. Table 1 describes how the goals, indicators, data collection, and
sample techniques of traditional tracking and conversions studies are distinct.
It is important to note if the goals of evaluation research are to measure
changes in awareness (tracking study) or determine visitation by persons
inquiring for information (conversion study).
Considerable tracking
and conversion study research has been done on the evaluation of the
effectiveness of tourism promotions (Ballman et al. 1982; Burke and Lindblom
1989; Tierney 1992; Van Hoof and Hobson 1997). Particularly insightful about the
problems with these types of research was a series of articles prepared by the
U.S. Department of Commerce Task Force on Tourism Research Accountability
(Wynegar 1989). Findings suggested that serious methodological problems were
numerous, including a lack of information about motive for seeking tourist
information (many are not visit related), if the promotional material had any
impact on their decision (to visit or buy), difficulty in quantifying the link
between advertising and tourist spending, and sample size and precision problems
(Davidson and Wiethaupt 1989; Burke and Gitelson 1990). Research evaluating the
effectiveness of tourism Web sites must also incorporate these concerns into
their study design.
METHOD
This research had an
overall goal of developing and testing an Internet-based methodology for
measuring the effectiveness of a tourism promotional Web site. It incorporated
more of a tracking-study approach, wherein an attempt was made to gather data
about intention to visit from a sample of all the persons who viewed the Web
site, versus a conversion approach that was limited to only persons who inquired
for information via the Web site.
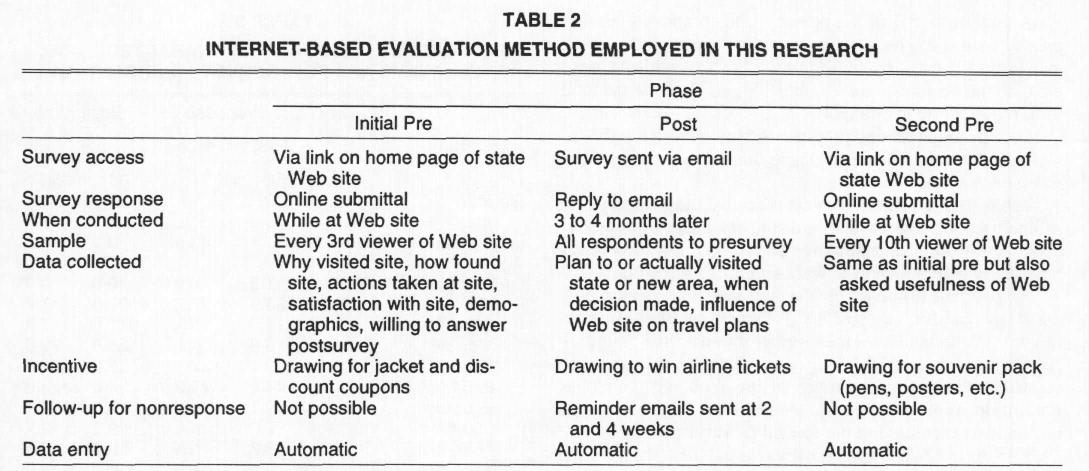
The overall research
design incorporated three phases (see Table 2). In the initial prephase survey,
data were gathered while the respondent was visiting the Web site. In the
postphase, a follow-up email survey was sent several months after visiting the
Web site during which consumer decisions may have been made. Finally, a second
prephase survey used a revised questionnaire and garnered more information on
the usefulness of the Web site.
The first
prequestionnaire was delivered to respondents through a link on the CalTour Web
site home page during the period September 5, 1997, through January 6, 1998. The
link was an animation that appeared to every third visitor to the state Web
site. It flashed the words "Win," then "A Special California
Jacket," and then "Enter By Clicking Here." After clicking on the
animation, the visitor was linked to a Web page that contained the online
survey. This alternating sampling was done to provide a systematic sample and to
produce a manageable number of survey responses.
Survey incentive was an
entry into a drawing to win either a California sesquicentennial embroidered
jacket or a California Fun Pack of discount coupons. These particular incentives
were selected because they have general appeal to persons interested in visiting
California, were related to the ongoing statewide celebration, but were not too
valuable as to draw contest site and unwanted viewers.
The study used Decisive
Survey Web surveying software produced by Decisive Technology (see http://www.messagemedia.com/) to write the survey questionnaire and make it into a file
that was later placed on the CalTour server. This software also received
responses submitted online, coded them, and automatically emailed responses to
an account at San Francisco State University (SFSU). The same software on a
desktop computer at SFSU then read the email and automatically entered the
response into a database file. Researchers at SFSU could then access the
database, view quickly generated tables and charts of results, and email these
to the study sponsors keeping them informed as the research progressed.
The two prephase
surveys were interactive questionnaires written to glean data on the viewers
reasons for visiting the Web site, their demographic characteristics, how they
learned about the Web site, satisfaction with it, actions taken while on the Web
site, and if they requested a brochure online. The motivation questions asked
respondents if they had already decided to visit the state and wanted Web-based
information to help them plan their trip, if they were considering visiting in
the next 2 years, or if they had no plans to visit the state soon. The survey
asked about actions they had already taken or planned to take immediately, such
as if they had viewed more than five pages, linked to another Web site via the
state site, or printed a page. The presurvey also asked respondents if they were
willing to respond to a follow-up survey and be eligible for additional prizes.
If they agreed, they were requested to provide their email address and other
contact information.
The postsurvey was
designed to gather information from respondents of the first presurvey to learn
if they visited the state and what effect their viewing of the state Web site
had on their visit. Each was asked if they made a trip to or through California
that was at least partially for leisure purposes since viewing the CalTour Web
site. Also asked was if they changed their travel as a result of viewing the
state Web site.
Respondents were
divided into residents and nonresidents, and each set was provided a separate,
but similar, survey. Nonresidents were asked if they visited the state.
Residents were asked if they visited a new city or area in California that was
at least 50 or more miles from their home. If a resident did not visit a new
area of the state more than 50 miles from home, then they were not asked further
impact questions.
Respondents who visited
new areas were asked if their decision to visit was made before or after they
viewed the state Web site. Those who had already decided to visit were asked if
viewing the Web site influenced them to stay longer and how many days longer.
All visitors were asked if they changed travel plans as a result of viewing the
Web site, if they visited a destination featured or advertised on the Web site,
and if the Web site influenced this visit. Similar questions asked if they dined
in a featured restaurant, attended an event, visited a store, or stayed at
lodging seen on the Web site. Respondents were also asked their likelihood of
visiting in the next 2 years and if viewing the Web site influenced their
probability of visiting.
The postsurvey was sent
from SFSU via email using the Decisive software. Replies were sent directly from
the respondent to an email account at SFSU. The survey was emailed on April 3,
1998, approximately 4 months after data collection stopped on the first
prephase. This lapse in time was designed to allow viewers to have made some
decisions about future visits but not so long as to create recall problems. The
postsurvey offered an incentive of a drawing to win a gift certificate for
airline travel within the state. This incentive was selected so it would appeal
to both nonresident and resident respondents. Nonrespondents were emailed a
reminder message and another survey twice before data collection was ended.
In the second version
of the presurvey, most questions remained the same to ensure comparability, but
several questions were added to measure usefulness of the Web site for finding
information about various types of state tourist facilities and services. Data
from this survey were collected from September 4 to October 22, 1998. The second
presurvey was accessed by clicking on a simple "Win Prize" image that
appeared to every 10th person's viewing of the CalTour Web site home page. The
incentive was a chance to win a "California Souvenir Pack," consisting
of pins, posters, and pens.
RESULTS
In the 5-month period
in which the first prephase survey was online, 762 persons clicked on the survey
animation and completed the questionnaire. To estimate response rates for the
survey Ca]Tour Web site, traffic statistics were compiled for the month of
October 1998 alone. In this 1 month, 844,024 hits and 33,943 user sessions were
recorded. The survey animation appeared 4,555 times, and 410 persons clicked on
the animation. This is a click-through rate of 9.0% of persons who could have
seen the animation. A total of 90 persons actually submitted a survey response.
Respondents represented 2.0% of total animation appearances and 21.9% of persons
who viewed the survey. Approximately 4.0% of initially completed surveys were
entered twice, and these duplicate entries were removed before statistical
compilation.
These response
statistics have both positive and negative connotations. Click-through rates for
Web-based ads during this same period were between 1.0% and 2.0%; therefore, a
9.0% rate for the animation was, by this measure, very high. But the 2.0% rate
of survey completion based on total views of the animation is low. The potential
for nonresponse seems very real. Counterbalancing this concern is that the total
number of respondents was relatively large (762) compared to many tourism
studies.
A total of 88.8% of the
persons who completed the first prephase survey agreed to participate in the
postphase survey and provided their email address. These individuals were
emailed the postphase survey, and 153, or 37.3% of the total sent, returned the
instrument.
Data from the second
prephase survey were collected for 47 days. A total of 71 responses to this
revised survey were received.
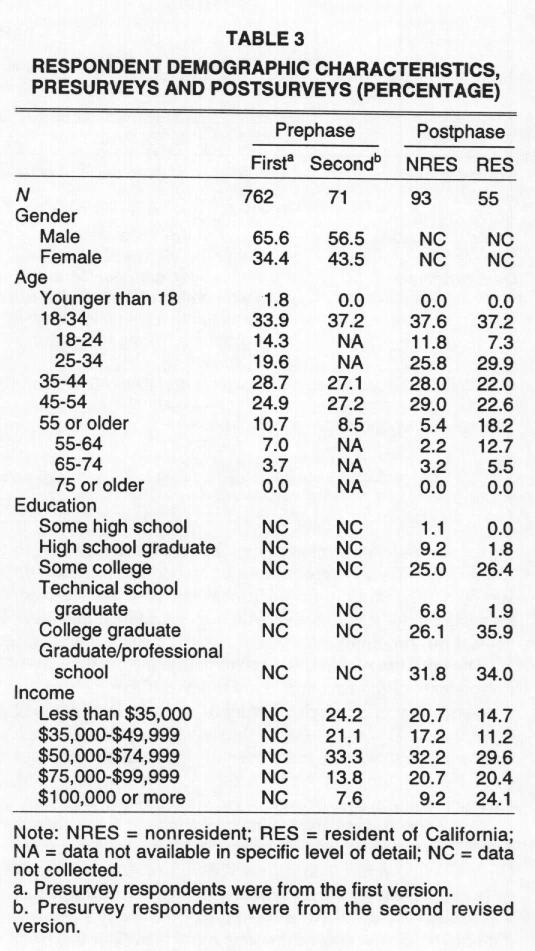
Table 3 shows that
respondents tended to be widely distributed among age groups, more likely male,
highly educated, and from a diverse range of incomes. Presurvey and postsurvey
respondent ages were similar.
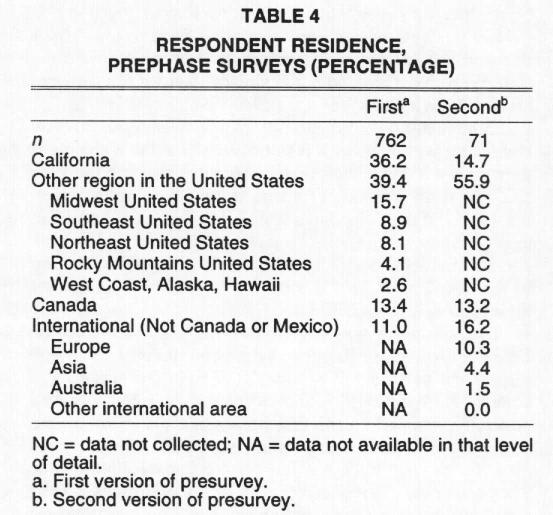
Respondent residence in
the first presurvey was dominated by California (36.2%), followed by the Midwest
(15.7%), Canada (13.4%), and other international countries (11.0%). More than
24.4% of respondents were from other countries, illustrating the reach of the
Web site for global promotion. Table 4 shows that the percentage of nonresident
respondents increased in the second presurvey.
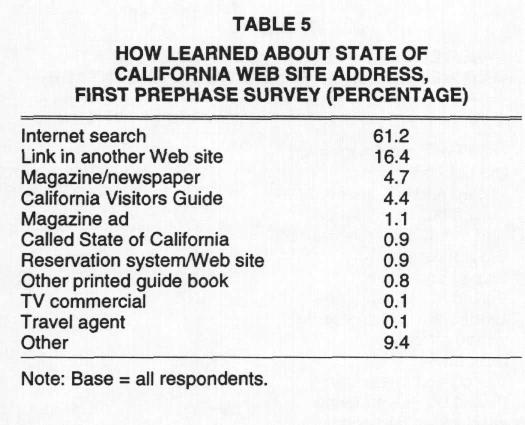
Visitors overwhelmingly
learned about the state Web site via investigations on the Internet (61.2%),
using search engines, such as Yahoo and Alta Vista. No other discovery method
was nearly as popular. Table 5 shows that a link in another Web site accounted
for 16.4% of respondents, followed by the address in a magazine or newspaper
(4.7%) and in state visitors guidebook (4.4%). These data provide a clear
indication of the most important locations where consumers learned about the
site.
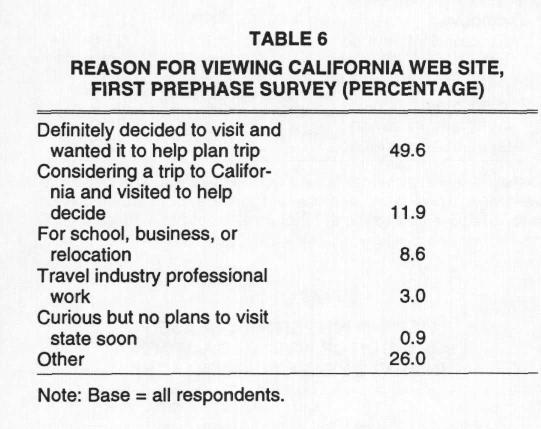
Almost half (49.6%) of
the first presurvey respondents had already decided to visit the state and were
visiting the Web site to help them plan their trip. Approximately 11.9% were
considering visiting the state and wanted the Web site information to help them
decide. Nearly two-thirds of respondents were using it for trip decision making.
About 8.6% were visiting the Web site for nontourist reasons, such as children
working on school projects, business, or relocation (see Table 6). Other reasons
were cited by 26.0% of respondents. Findings suggest that most of the
respondents were the intended target of the Web site sponsors.
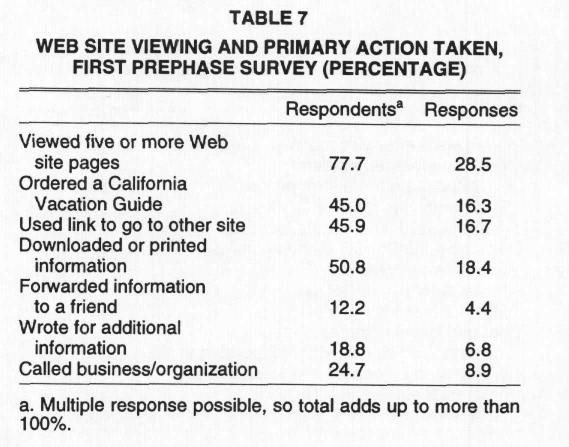
Table 7 shows specific
respondent behavior and actions taken while on the Web site or planned
immediately afterward. More than 77% of respondents reported that they viewed
five or more pages on the Web site, 50.8% downloaded or printed Web site
information, 45.9% used a link on the Web site to go to another site, 45.0%
ordered a state vacation guidebook online, 24.7% called a business found in the
Web site, 18.8% wrote for additional information, and 12.2% forwarded (emailed)
information on the Web site to a friend. Findings suggest that respondents were
active while on the Web site, and more than half took immediate actions.
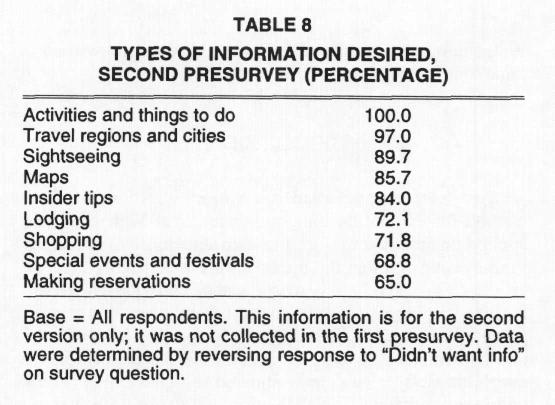
A series of questions
asked respondents of the second presurvey about the usefulness of the Web site
in providing nine categories of information and if they wanted that type of
information. Table 8 shows that 100.0% of respondents were interested in
information about activities and things to do, 97.0% in travel regions and
cities, 89.7% in sightseeing opportunities, 85.7% in maps, 72.1 % in information
on lodging, and 65.0% in information about making reservations. Results suggest
that a wide range of information was wanted by respondents but also the
importance of content on activities and things to do.
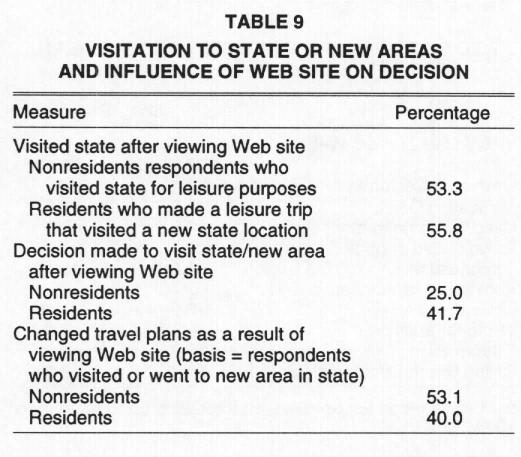
The postsurvey asked
nonresident respondents if they traveled to the state on a trip that was at
least partially for leisure purposes, after viewing the Web site. A total of
53.3% stated that they took at least one such trip (see Table 9). Respondents
who were residents were asked if they took a trip to a new area in the state,
which was at least partially for leisure pursuits, and/or which was more than 50
miles from their home since viewing the Web site. A total of 78.2% of residents
took at least one such trip. Findings show that of those nonresidents who
traveled to the state, 79.6% took a trip to an area they had not previously
visited. More than 55.8% of residents who made a leisure trip visited a new
location.
Residents who visited a
new location in the state and nonresidents who went to California were asked if
their decision to take that trip was made before or after viewing the state Web
site. A total of 75.0% of nonresidents and 58.3% of residents reported that the
decision was made before they accessed the state Web site. Of those who decided
before viewing the Web site, 27.8% of nonresidents and 50.0% of residents
recorded that they stayed longer than originally planned due to the Web site
visit. These data suggest that even though the majority of respondents had
already decided to visit the state, the Web site did influence their trip plans
and spending.
The next questions
asked nonresidents who visited the state and residents who went to a new area if
they changed their travel plans as a result of viewing the state Web site. A
total of 53.1% of nonresidents and 40.0% of residents reported that they did
change their travel plans in California as a result of viewing the Web site (see
Table 9).
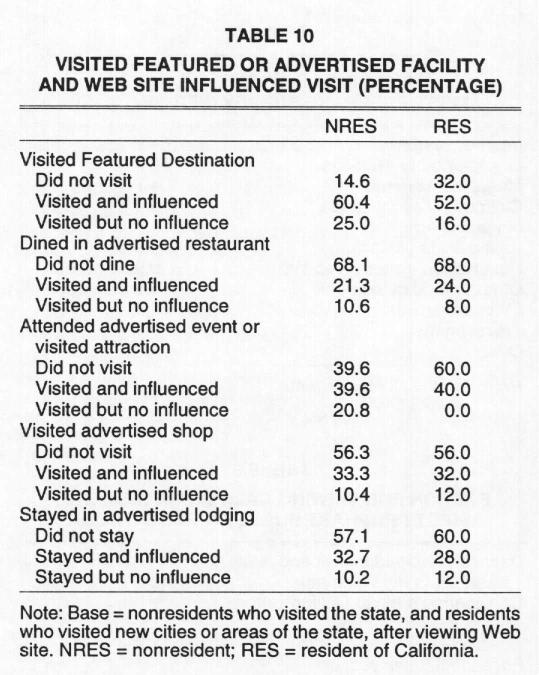
A final series of
questions queried residents who visited new areas and nonresidents who came to
the state if they visited a facility or service that was advertised or featured
in the state Web site, and if the Web site influenced their visit to this
location. Table 10 shows that 85.4% of nonresidents and 68.0% of residents
visited a featured destination and that 60.4% of nonresidents and 52.0% of
residents replied that the Web site influenced this decision. The next greatest
influence was on visiting an advertised event or attraction, wherein 39.6% of
nonresidents and 40.0% of residents reported that the Web site influenced their
visit. Results show that the Web site influenced many aspects of trip planning
for both residents and nonresidents.
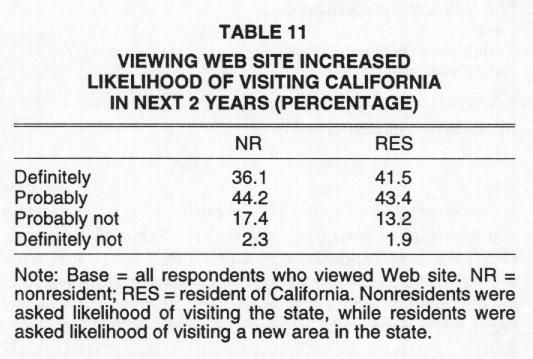
A final indicator of
the influence that the state Web site has on travel behavior was a question
asking all respondents about the Web site's potential impact on visiting
California in the near future. Table 11 shows that 84.9% of residents reported
that the Web site increased their likelihood of visiting new areas in the state,
while 80.3% of nonresidents recorded that it would increase their likelihood of
visiting California in the next 2 years. Besides showing an immediate Web site
impact, results suggest that the Web site will continue to influence future
visitation.
DISCUSSION
This research attempted
to develop an efficient online method for evaluating tourism promotional Web
sites and applied this method to a well-known state tourism Web site. Findings
showed that the methodology used in this study is efficient, is relatively easy
to use, and can provide a low-cost means of surveying. Results suggest that this
method has the potential to revolutionize some types of survey research and
allow businesses to more frequently contact clients. However, this study also
clearly showed the challenges facing online surveying and the evaluation of
tourism Web sites.
The largest problem
encountered with this research method was the low 2.0% response rate. This was
confounded further by a 37.0% response rate to the postphase survey. Such a low
response certainly makes one suspect the validity of the sample and how well it
accurately represents the actual population of visitors to the tourism Web site.
However, offsetting to some degree the nonresponse problem is the relatively
large number of responses that can be economically gathered with online methods.
Does the large sample
size overcome the low response rate in this study? Findings of this research
suggest that they do not. It is unlikely that survey respondents are
representative of the average visitor to the Web site. This is based on the
discrepancy between the percentage of respondents who ordered a state visitors
guide (45.9%) and the Web site traffic statistics on the number of visitors to
the state Web site who clicked on the brochure order form. To confirm this, the
Web master for the state site was contacted and reported that 1.5% was the
average visitor guide requests, as a percentage of user sessions, between fall
1998 and winter 1999 (Wantanabe, personal communications, January 1, 2000).
Therefore, respondents were much more likely to request a brochure (45.9%)
compared to the average site visitor (1.5%). They were probably much more likely
to visit the state as well, based on research by Ellerbrock (1981) and Burke and
Gitelson (1990), which showed that respondents who complete mail and telephone
surveys are significantly more likely to visit the destination than those who do
not respond. This suggests that it does not matter how large a sample size you
acquire in an Internet-based survey if respondents differ significantly from
nonrespondents.
There appears to be few easy ways to get information on Web survey nonrespondents in tracking studies to determine if they are different from respondents. The nature of the Internet does not allow one to gather much information about nonrespondents without their providing it. Web traffic software can only provide data such as domain name and type, region or country of request, and organization type. An alternative to check for nonresponse bias is comparing key sales, coupon offer, or brochure order click rates for respondents and nonrespondents. But this approach still gives no data on key nonrespondent demographic data, such as income, or reasons for visiting the site.
Results of this study
collaborate with research by Schonland and Williams (1996), which suggest that
incentives used to lure Web site viewers to an online survey can influence the
type of respondents and subsequent responses. This affects reliability and
validity. Different basic appeals for an incentive may be more successful than
others. For example, a "please help" or a "contest" appeal
may be more effective than "win." CalTour has changed to a
"contest" button on their home page for access to their new evaluation
survey, and this appears to have increased response over a "win"
appeal used in this study. Study findings also suggest that even the best
incentives have only limited ability to lure a majority of Web site visitors. So
what else can be done to provide better information about Web site visitors?
Placing the entry link
for the survey in a more visible place on the Web page could help viewers find
the survey easier. This is a revision that CalTour made based on the findings of
this research. Placement of a half page "pop-up" screen to a sample of
viewers' asking them to fill out a survey could boost response.
Registration of
visitors, wherein they must provide a minimum of data about themselves before
they are able to proceed to the rest of the Web site, is one approach being used
to gather demographic data. However, Web users are so concerned about privacy of
their personal information that registration has been shown to discourage sites
visitation (Neilson 1999).
The methods used in
this study may be much more effective for types of research in which the email
address of the Web site visitor is known, such as in conversion studies,
questionnaires to existing clients, and product evaluations. Much of the
challenge with the method used in this research was how to get a sample of all
Web site viewers, not just those who inquired for information. If the goal of
the investigation is more akin to a "tracking" study and learning
about influences on all viewers, then considerable advancements in sampling are
needed. But where the research purpose is strictly a conversion type of goal of
determining how many inquirers converted to visitors, then an Internet-based
approach, such as employed in this study and that used in Arkansas, may be
effective.
Despite the limitations
and nonresponse concerns of the Internet-based survey method applied in this
study, it did provide important new insights into a unique, but not necessarily
representative, subset of the population viewing the CalTour Web site.
Respondents to the Web site survey were from a broad range of income and age
groups, and a high percentage were international residents. The majority of
respondents had already decided to visit California and wanted the Web site to
assist in trip planning.
Findings clearly
demonstrate that the Web site influenced respondent travel plans to California,
for both residents and nonresidents. In addition to the Web site's immediate
impact, it also increased the likelihood of nonresidents visiting California and
of residents going to new areas of the state in the next 2 years.
Results also suggest
that a state Web site can influence large numbers of residents to visit new
destinations in the state. Tourism Web sites may be able to keep more residents
in state and to distribute their spending to new, often rural areas.
FUTURE RESEARCH
Future research into
tourism Web site evaluation should check for and identify the influence of
nonresponse bias. Findings suggest that respondents and nonrespondents may be
very different demographically and undertake different actions as a result of
visiting the site. Findings also suggest that large sample sizes do not correct
for differences between respondents and nonrespondents. This should also be
confirmed.
An important area for
future research is the identification of the impact of different incentives on
response rates and respondent characteristics. New incentives, placement of
incentives, or new technological innovations are required to improve response
and research validity.
A topic that may be
useful for future Web site assessment is an evaluation of the attributes of the
site itself for ease of navigation, finding, and requesting information. Such
data could help improve design aspects of the site.
Finally, it is
essential to verify Web site performance standards. What is the normal range for
percentage of respondents who view a site but do not request information online?
What is the typical percentage of viewers who request information online or who
book online?
[Reference]
REFERENCES
[Reference]
Association of National
Advertisers (1999). "Third Annual ANA Web Site Study Indicates Emphasis on
Web Marketing: Increases in Online Advertising Expected." Press Release
[Online]. Available http://www.ana.net (May 4)
Ballman, G., J. Burke, D. Korte, and U. Blank (1982). "Real Conversion
Rates of Regional Advertising Programs: Working from Gross to Net Rates."
Proceedings of the Thirteenth Annual Conference of the Travel Tourism Research
Association, Miami, FL.
Burke, J., and R. Gitelson (1990). "Conversion Studies: Assumptions,
Applications, Accuracy and Abuse." Journal of Travel Research, 28 (3):
46-51.
Burke, J., and L. Lindblom (1989). "Strategies for Evaluating Direct
Response Tourism Marketing." Journal of Travel Research, 28 (2): 33-7.
Davidson, T. L., and W. B. Weithaupt (1989). "Accountability Marketing
Research: An Increasingly Vital Tool for Travel Marketers." Journal of
Travel Research, 27 (4): 42-4.
Ellerbrock, M. (1981). "Improving Conversion Studies: A Comment."
Journal of Travel Research, 27 (1): 35-40.
Forrester Research (1999). "Web Site Success Transcends Hits and Page
Views, Predicts Forrester Research." Press Release [Online]. Available:
http://www.forrester.com
[Reference]
Jupiter Communications (2000).
"Online Holiday Sales Hit $7 Billion, Consumer Satisfaction Rising."
Press Release [Online]. Available: http://www.jup.com
(January 14)
McLemore, C., and N. Mitchell (2000). "The 1999 Arkansas Internet
Conversion Study." Newsletter of the Travel and Tourism Research
Association, Spring, 4-5.
Neilson, J. (1999). "Web Research: Believe the Data." Alertbox
[Online]. Available: http://www.useit.com (July 11)
Schonland, A., and P. W. Williams (1996). "Using the Internet for Travel
and Tourism Survey Research: Experiences from the Net Traveler Survey."
Journal of Travel Research, 35 (2): 81-87.
Tierney, P. T. (1992). "Developing and Testing of a Model and Method for
Assessing Effectiveness of Tourism Promotional Literature." Visions in
Leisure and Business, 10 (3): 4-14.
Tourism Industries of America (1997). "Travelers' Use of the Internet;
1997." Executive Report, October, Washington, DC.
(1999). "TIA Report Says Online Travel Revenue Triples in 1997: Sales to
Increase 440% to $4.7 Billion in Year 2000." Press Release, February 28,
Washington, DC.
Van Hoof, H. B., and J. S. Hobson (1997). "Tourism Research Inquires: The
Response of the State Office of Tourism." Journal of Travel Research, 35
(4): 77-81.
WebTrends (2000). "Definition of Terms" [Online]. Available:
http://www.webtrends.com (January 14)
Wynegar, D. (1989). "U.S. Department of Commerce Task Force on
Accountability Research." Journal of Travel Research, 27 (4): 41.
[Author note]
Patrick Tierney is a professor
in the Department of Recreation and Leisure Studies at San Francisco State
University. He thanks Eileen Hook for her assistance in preparing this article.
![]()
![]()