| Output Created | 15-MAY-2002 08:55:19 | |
|---|---|---|
| Comments | ||
| Input | Data | C:\Documents and Settings olanlp.AMEDDCS\My Documents\Baylor\4th Semester\Networking\mpsrgx.sav |
| Filter | <none> | |
| Weight | <none> | |
| Split File | <none> | |
| N of Rows in Working Data File | 22538 | |
| Missing Value Handling | Definition of Missing | User-defined missing values are treated as missing. |
| Cases Used | Statistics for each table are based on all the cases with valid data in the specified range(s) for all variables in each table. | |
| Syntax | CROSSTABS /TABLES=service BY clinname /FORMAT= AVALUE TABLES /STATISTIC=CORR /CELLS= COUNT . |
|
| Resources | Dimensions Requested | 2 |
| Cells Available | 7709 | |
| Elapsed Time | 0:00:02.21 | |
| CORR statistics are available for numeric data only. |
| Cases | ||||||
|---|---|---|---|---|---|---|
| Valid | Missing | Total | ||||
| N | Percent | N | Percent | N | Percent | |
| SERVICE * CLINNAME | 22538 | 100.0% | 0 | .0% | 22538 | 100.0% |
| CLINNAME | Total | ||||||||||||||||||||||||||||||||||||||||||||||||
|---|---|---|---|---|---|---|---|---|---|---|---|---|---|---|---|---|---|---|---|---|---|---|---|---|---|---|---|---|---|---|---|---|---|---|---|---|---|---|---|---|---|---|---|---|---|---|---|---|---|
| Adolescent Clinic | Allergy Clinic | Audiology Clinic | Cardiology Clinic | Cardiovasc. & Thoracic Surgery Clinic | Cardiovascular & Thoracic Surgery Clinic | Cast Clinic | Community Health Clinic | Dermatology Clinic | Developmental Pediatric Clinic | Emergency Medical Clinic | Endocrinology (Metabolism) Clinic | Family Practice Clinic | Flight Medicine Care | Gastroenterology Clinic | General Surgery Clinic | Gynecology Clinic | Hematology Clinic | Immediate Care Clinic | Infectious Disease Clinic | Internal Medicine Clinic | Medical Examination Clinic | Nephrology Clinic | Neurology Clinic | Nutrition Clinic | Obstetrics Clinic | Occupational Health Clinic | Occupational Therapy Clinic | Oncology Clinic | Ophthalmology Clinic | Optometry Clinic | Orthopedic Clinic | Orthopedic Laboratory | Orthotic Laboratory | Otolarangyology or Otorhinolarangyology | Otolaryngology Clinic | Pediatric Clinic | Pediatric Well Baby Clinic | Physical Medicine Clinic | Physical Therapy Clinic | Plastic Surgery Clinic | Podiatry Clinic | Primary Care Clinic | Pulmonary Disease Clinic | Rheumatology Clinic | Urology Clinic | Well Baby Clinic | |||
| SERVICE | A | 227 | 312 | 378 | 421 | 221 | 69 | 284 | 161 | 364 | 203 | 236 | 393 | 365 | 45 | 383 | 339 | 282 | 86 | 259 | 426 | 90 | 344 | 342 | 216 | 195 | 153 | 268 | 422 | 458 | 225 | 282 | 51 | 212 | 61 | 270 | 234 | 39 | 268 | 280 | 302 | 309 | 198 | 388 | 420 | 436 | 256 | 12173 | |
| F | 147 | 246 | 366 | 212 | 13 | 348 | 112 | 612 | 202 | 235 | 255 | 256 | 3004 | ||||||||||||||||||||||||||||||||||||
| N | 48 | 292 | 402 | 526 | 153 | 623 | 473 | 602 | 179 | 446 | 116 | 438 | 441 | 405 | 50 | 268 | 500 | 485 | 567 | 347 | 7361 | ||||||||||||||||||||||||||||
| Total | 227 | 312 | 378 | 421 | 221 | 69 | 332 | 161 | 803 | 203 | 638 | 393 | 1137 | 564 | 383 | 1174 | 755 | 86 | 13 | 259 | 1376 | 90 | 344 | 342 | 395 | 641 | 269 | 268 | 422 | 1008 | 1278 | 889 | 51 | 212 | 111 | 538 | 969 | 39 | 268 | 1020 | 302 | 309 | 1021 | 388 | 420 | 783 | 256 | 22538 | |
| Value | |
|---|---|
| N of Valid Cases | 22538 |
| a Correlation statistics are available for numeric data only. | |
| Output Created | 15-MAY-2002 08:55:50 | |
|---|---|---|
| Comments | ||
| Input | Data | C:\Documents and Settings olanlp.AMEDDCS\My Documents\Baylor\4th Semester\Networking\mpsrgx.sav |
| Filter | <none> | |
| Weight | <none> | |
| Split File | <none> | |
| N of Rows in Working Data File | 22538 | |
| Missing Value Handling | Definition of Missing | User-defined missing values are treated as missing. |
| Cases Used | Statistics for each table are based on all the cases with valid data in the specified range(s) for all variables in each table. | |
| Syntax | CROSSTABS /TABLES=clinname BY service /FORMAT= AVALUE TABLES /STATISTIC=CORR /CELLS= COUNT . |
|
| Resources | Dimensions Requested | 2 |
| Cells Available | 7709 | |
| Elapsed Time | 0:00:01.27 | |
| CORR statistics are available for numeric data only. |
| Cases | ||||||
|---|---|---|---|---|---|---|
| Valid | Missing | Total | ||||
| N | Percent | N | Percent | N | Percent | |
| CLINNAME * SERVICE | 22538 | 100.0% | 0 | .0% | 22538 | 100.0% |
| SERVICE | Total | ||||
|---|---|---|---|---|---|
| A | F | N | |||
| CLINNAME | Adolescent Clinic | 227 | 227 | ||
| Allergy Clinic | 312 | 312 | |||
| Audiology Clinic | 378 | 378 | |||
| Cardiology Clinic | 421 | 421 | |||
| Cardiovasc. & Thoracic Surgery Clinic | 221 | 221 | |||
| Cardiovascular & Thoracic Surgery Clinic | 69 | 69 | |||
| Cast Clinic | 284 | 48 | 332 | ||
| Community Health Clinic | 161 | 161 | |||
| Dermatology Clinic | 364 | 147 | 292 | 803 | |
| Developmental Pediatric Clinic | 203 | 203 | |||
| Emergency Medical Clinic | 236 | 402 | 638 | ||
| Endocrinology (Metabolism) Clinic | 393 | 393 | |||
| Family Practice Clinic | 365 | 246 | 526 | 1137 | |
| Flight Medicine Care | 45 | 366 | 153 | 564 | |
| Gastroenterology Clinic | 383 | 383 | |||
| General Surgery Clinic | 339 | 212 | 623 | 1174 | |
| Gynecology Clinic | 282 | 473 | 755 | ||
| Hematology Clinic | 86 | 86 | |||
| Immediate Care Clinic | 13 | 13 | |||
| Infectious Disease Clinic | 259 | 259 | |||
| Internal Medicine Clinic | 426 | 348 | 602 | 1376 | |
| Medical Examination Clinic | 90 | 90 | |||
| Nephrology Clinic | 344 | 344 | |||
| Neurology Clinic | 342 | 342 | |||
| Nutrition Clinic | 216 | 179 | 395 | ||
| Obstetrics Clinic | 195 | 446 | 641 | ||
| Occupational Health Clinic | 153 | 116 | 269 | ||
| Occupational Therapy Clinic | 268 | 268 | |||
| Oncology Clinic | 422 | 422 | |||
| Ophthalmology Clinic | 458 | 112 | 438 | 1008 | |
| Optometry Clinic | 225 | 612 | 441 | 1278 | |
| Orthopedic Clinic | 282 | 202 | 405 | 889 | |
| Orthopedic Laboratory | 51 | 51 | |||
| Orthotic Laboratory | 212 | 212 | |||
| Otolarangyology or Otorhinolarangyology | 61 | 50 | 111 | ||
| Otolaryngology Clinic | 270 | 268 | 538 | ||
| Pediatric Clinic | 234 | 235 | 500 | 969 | |
| Pediatric Well Baby Clinic | 39 | 39 | |||
| Physical Medicine Clinic | 268 | 268 | |||
| Physical Therapy Clinic | 280 | 255 | 485 | 1020 | |
| Plastic Surgery Clinic | 302 | 302 | |||
| Podiatry Clinic | 309 | 309 | |||
| Primary Care Clinic | 198 | 256 | 567 | 1021 | |
| Pulmonary Disease Clinic | 388 | 388 | |||
| Rheumatology Clinic | 420 | 420 | |||
| Urology Clinic | 436 | 347 | 783 | ||
| Well Baby Clinic | 256 | 256 | |||
| Total | 12173 | 3004 | 7361 | 22538 | |
| Value | |
|---|---|
| N of Valid Cases | 22538 |
| a Correlation statistics are available for numeric data only. | |
| Output Created | 15-MAY-2002 09:00:50 | |
|---|---|---|
| Comments | ||
| Input | Data | C:\Documents and Settings olanlp.AMEDDCS\My Documents\Baylor\4th Semester\Networking\mpsrgx.sav |
| Filter | <none> | |
| Weight | <none> | |
| Split File | <none> | |
| N of Rows in Working Data File | 1020 | |
| Missing Value Handling | Definition of Missing | User-defined missing values are treated as missing. |
| Cases Used | Statistics are based on all cases with valid data for all variables in the model. | |
| Syntax | UNIANOVA q5 BY service mgender magegrp /METHOD = SSTYPE(3) /INTERCEPT = INCLUDE /PLOT = PROFILE( magegrp*service*mgender ) /PRINT = DESCRIPTIVE ETASQ /CRITERIA = ALPHA(.05) /DESIGN = service mgender magegrp service*mgender service*magegrp mgender *magegrp service*mgender*magegrp . |
|
| Resources | Elapsed Time | 0:00:01.89 |
| Value Label | N | ||
|---|---|---|---|
| SERVICE | A | 277 | |
| F | 251 | ||
| N | 475 | ||
| MGENDER | 1 | F | 444 |
| 2 | M | 559 | |
| MAGEGRP | 2 | B | 16 |
| 3 | C | 10 | |
| 4 | D | 80 | |
| 5 | E | 237 | |
| 6 | F | 274 | |
| 7 | G | 292 | |
| 8 | H | 94 | |
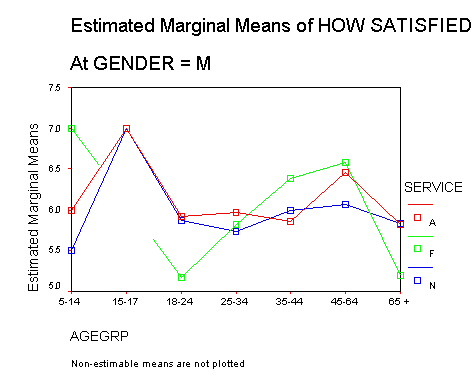
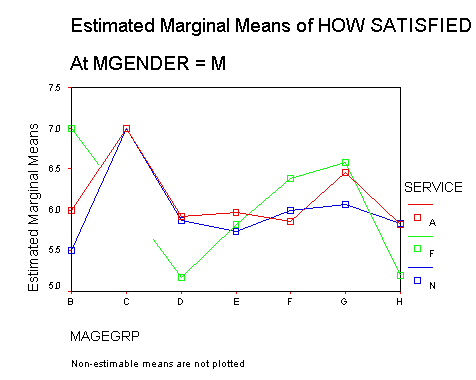
| SERVICE | MGENDER | MAGEGRP | Mean | Std. Deviation | N |
|---|---|---|---|---|---|
| A | F | B | 7.00 | .000 | 2 |
| C | 6.00 | .000 | 2 | ||
| D | 6.08 | 1.240 | 12 | ||
| E | 5.62 | 1.522 | 29 | ||
| F | 4.79 | 2.245 | 24 | ||
| G | 5.93 | 1.880 | 27 | ||
| H | 6.62 | .650 | 13 | ||
| Total | 5.72 | 1.754 | 109 | ||
| M | B | 6.00 | . | 1 | |
| C | 7.00 | .000 | 2 | ||
| D | 5.92 | 1.706 | 13 | ||
| E | 5.96 | .963 | 57 | ||
| F | 5.86 | 1.407 | 43 | ||
| G | 6.46 | .980 | 35 | ||
| H | 5.82 | 1.629 | 17 | ||
| Total | 6.04 | 1.238 | 168 | ||
| Total | B | 6.67 | .577 | 3 | |
| C | 6.50 | .577 | 4 | ||
| D | 6.00 | 1.472 | 25 | ||
| E | 5.85 | 1.183 | 86 | ||
| F | 5.48 | 1.812 | 67 | ||
| G | 6.23 | 1.453 | 62 | ||
| H | 6.17 | 1.341 | 30 | ||
| Total | 5.91 | 1.468 | 277 | ||
| F | F | B | 7.00 | .000 | 2 |
| C | 7.00 | . | 1 | ||
| D | 6.42 | 1.240 | 12 | ||
| E | 5.79 | 1.437 | 19 | ||
| F | 6.48 | .873 | 21 | ||
| G | 6.49 | 1.052 | 69 | ||
| H | 6.80 | .561 | 15 | ||
| Total | 6.43 | 1.077 | 139 | ||
| M | B | 7.00 | .000 | 3 | |
| D | 5.17 | 1.329 | 6 | ||
| E | 5.83 | 1.642 | 23 | ||
| F | 6.38 | .661 | 42 | ||
| G | 6.58 | .663 | 33 | ||
| H | 5.20 | 2.490 | 5 | ||
| Total | 6.22 | 1.152 | 112 | ||
| Total | B | 7.00 | .000 | 5 | |
| C | 7.00 | . | 1 | ||
| D | 6.00 | 1.372 | 18 | ||
| E | 5.81 | 1.534 | 42 | ||
| F | 6.41 | .733 | 63 | ||
| G | 6.52 | .941 | 102 | ||
| H | 6.40 | 1.429 | 20 | ||
| Total | 6.34 | 1.114 | 251 | ||
| N | F | B | 6.50 | .577 | 4 |
| C | 6.67 | .577 | 3 | ||
| D | 5.15 | 1.281 | 13 | ||
| E | 6.23 | 1.165 | 40 | ||
| F | 5.95 | 1.380 | 44 | ||
| G | 6.12 | 1.343 | 67 | ||
| H | 6.64 | .810 | 25 | ||
| Total | 6.12 | 1.267 | 196 | ||
| M | B | 5.50 | 1.732 | 4 | |
| C | 7.00 | .000 | 2 | ||
| D | 5.88 | 1.116 | 24 | ||
| E | 5.74 | 1.411 | 69 | ||
| F | 6.00 | 1.385 | 100 | ||
| G | 6.07 | 1.377 | 61 | ||
| H | 5.84 | 1.500 | 19 | ||
| Total | 5.93 | 1.374 | 279 | ||
| Total | B | 6.00 | 1.309 | 8 | |
| C | 6.80 | .447 | 5 | ||
| D | 5.62 | 1.210 | 37 | ||
| E | 5.92 | 1.341 | 109 | ||
| F | 5.99 | 1.379 | 144 | ||
| G | 6.09 | 1.354 | 128 | ||
| H | 6.30 | 1.212 | 44 | ||
| Total | 6.01 | 1.333 | 475 | ||
| Total | F | B | 6.75 | .463 | 8 |
| C | 6.50 | .548 | 6 | ||
| D | 5.86 | 1.337 | 37 | ||
| E | 5.93 | 1.363 | 88 | ||
| F | 5.76 | 1.679 | 89 | ||
| G | 6.25 | 1.348 | 163 | ||
| H | 6.68 | .701 | 53 | ||
| Total | 6.12 | 1.374 | 444 | ||
| M | B | 6.13 | 1.356 | 8 | |
| C | 7.00 | .000 | 4 | ||
| D | 5.79 | 1.337 | 43 | ||
| E | 5.84 | 1.295 | 149 | ||
| F | 6.05 | 1.271 | 185 | ||
| G | 6.30 | 1.143 | 129 | ||
| H | 5.76 | 1.655 | 41 | ||
| Total | 6.02 | 1.294 | 559 | ||
| Total | B | 6.44 | 1.031 | 16 | |
| C | 6.70 | .483 | 10 | ||
| D | 5.83 | 1.329 | 80 | ||
| E | 5.87 | 1.318 | 237 | ||
| F | 5.96 | 1.420 | 274 | ||
| G | 6.27 | 1.260 | 292 | ||
| H | 6.28 | 1.290 | 94 | ||
| Total | 6.06 | 1.331 | 1003 |
| Source | Type III Sum of Squares | df | Mean Square | F | Sig. | Partial Eta Squared |
|---|---|---|---|---|---|---|
| Corrected Model | 152.010(a) | 40 | 3.800 | 2.254 | .000 | .086 |
| Intercept | 7458.880 | 1 | 7458.880 | 4424.079 | .000 | .821 |
| SERVICE | 3.400 | 2 | 1.700 | 1.008 | .365 | .002 |
| MGENDER | 1.115 | 1 | 1.115 | .661 | .416 | .001 |
| MAGEGRP | 36.198 | 6 | 6.033 | 3.578 | .002 | .022 |
| SERVICE * MGENDER | 2.484 | 2 | 1.242 | .737 | .479 | .002 |
| SERVICE * MAGEGRP | 37.734 | 12 | 3.145 | 1.865 | .035 | .023 |
| MGENDER * MAGEGRP | 31.985 | 6 | 5.331 | 3.162 | .004 | .019 |
| SERVICE * MGENDER * MAGEGRP | 22.241 | 11 | 2.022 | 1.199 | .283 | .014 |
| Error | 1621.907 | 962 | 1.686 | |||
| Total | 38654.000 | 1003 | ||||
| Corrected Total | 1773.916 | 1002 | ||||
| a R Squared = .086 (Adjusted R Squared = .048) | ||||||
| Output Created | 22-MAY-2002 08:11:46 | |
|---|---|---|
| Comments | ||
| Input | Data | C:\Documents and Settings olanlp.AMEDDCS\My Documents\Baylor\4th Semester\Networking\mpsrgx.sav |
| Filter | <none> | |
| Weight | <none> | |
| Split File | <none> | |
| N of Rows in Working Data File | 1020 | |
| Missing Value Handling | Definition of Missing | User-defined missing values are treated as missing. |
| Cases Used | Statistics are based on all cases with valid data for all variables in the model. | |
| Syntax | UNIANOVA q5 BY service agegrp /METHOD = SSTYPE(3) /INTERCEPT = INCLUDE /PLOT = PROFILE( agegrp*service ) /PRINT = DESCRIPTIVE ETASQ /CRITERIA = ALPHA(.05) /DESIGN = service agegrp service*agegrp . |
|
| Resources | Elapsed Time | 0:00:04.97 |
| Value Label | N | ||
|---|---|---|---|
| SERVICE | A | 277 | |
| F | 251 | ||
| N | 475 | ||
| AGEGRP | B | 5-14 | 16 |
| C | 15-17 | 10 | |
| D | 18-24 | 80 | |
| E | 25-34 | 237 | |
| F | 35-44 | 274 | |
| G | 45-64 | 292 | |
| H | 65 + | 94 | |
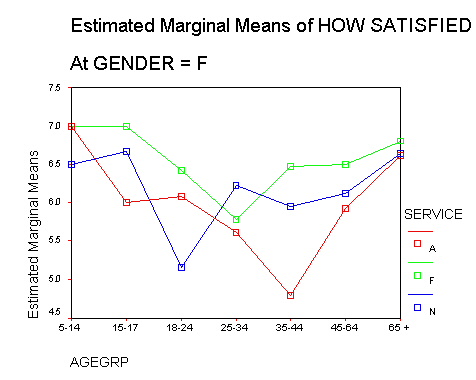
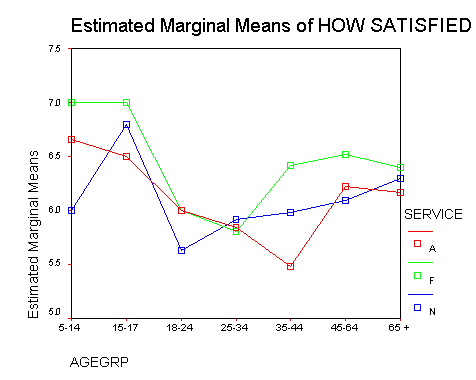
| SERVICE | AGEGRP | Mean | Std. Deviation | N |
|---|---|---|---|---|
| A | 5-14 | 6.67 | .577 | 3 |
| 15-17 | 6.50 | .577 | 4 | |
| 18-24 | 6.00 | 1.472 | 25 | |
| 25-34 | 5.85 | 1.183 | 86 | |
| 35-44 | 5.48 | 1.812 | 67 | |
| 45-64 | 6.23 | 1.453 | 62 | |
| 65 + | 6.17 | 1.341 | 30 | |
| Total | 5.91 | 1.468 | 277 | |
| F | 5-14 | 7.00 | .000 | 5 |
| 15-17 | 7.00 | . | 1 | |
| 18-24 | 6.00 | 1.372 | 18 | |
| 25-34 | 5.81 | 1.534 | 42 | |
| 35-44 | 6.41 | .733 | 63 | |
| 45-64 | 6.52 | .941 | 102 | |
| 65 + | 6.40 | 1.429 | 20 | |
| Total | 6.34 | 1.114 | 251 | |
| N | 5-14 | 6.00 | 1.309 | 8 |
| 15-17 | 6.80 | .447 | 5 | |
| 18-24 | 5.62 | 1.210 | 37 | |
| 25-34 | 5.92 | 1.341 | 109 | |
| 35-44 | 5.99 | 1.379 | 144 | |
| 45-64 | 6.09 | 1.354 | 128 | |
| 65 + | 6.30 | 1.212 | 44 | |
| Total | 6.01 | 1.333 | 475 | |
| Total | 5-14 | 6.44 | 1.031 | 16 |
| 15-17 | 6.70 | .483 | 10 | |
| 18-24 | 5.83 | 1.329 | 80 | |
| 25-34 | 5.87 | 1.318 | 237 | |
| 35-44 | 5.96 | 1.420 | 274 | |
| 45-64 | 6.27 | 1.260 | 292 | |
| 65 + | 6.28 | 1.290 | 94 | |
| Total | 6.06 | 1.331 | 1003 |
| Source | Type III Sum of Squares | df | Mean Square | F | Sig. | Partial Eta Squared |
|---|---|---|---|---|---|---|
| Corrected Model | 85.720(a) | 20 | 4.286 | 2.493 | .000 | .048 |
| Intercept | 6968.154 | 1 | 6968.154 | 4053.278 | .000 | .805 |
| SERVICE | 3.504 | 2 | 1.752 | 1.019 | .361 | .002 |
| AGEGRP | 36.760 | 6 | 6.127 | 3.564 | .002 | .021 |
| SERVICE * AGEGRP | 25.719 | 12 | 2.143 | 1.247 | .246 | .015 |
| Error | 1688.196 | 982 | 1.719 | |||
| Total | 38654.000 | 1003 | ||||
| Corrected Total | 1773.916 | 1002 | ||||
| a R Squared = .048 (Adjusted R Squared = .029) | ||||||
| Output Created | 22-MAY-2002 08:17:33 | |
|---|---|---|
| Comments | ||
| Input | Data | C:\Documents and Settings olanlp.AMEDDCS\My Documents\Baylor\4th Semester\Networking\mpsrgx.sav |
| Filter | <none> | |
| Weight | <none> | |
| Split File | <none> | |
| N of Rows in Working Data File | 1020 | |
| Missing Value Handling | Definition of Missing | User-defined missing values are treated as missing. |
| Cases Used | Statistics are based on all cases with valid data for all variables in the model. | |
| Syntax | UNIANOVA q5 BY service agegrp gender /METHOD = SSTYPE(3) /INTERCEPT = INCLUDE /PLOT = PROFILE( agegrp*service*gender ) /PRINT = DESCRIPTIVE ETASQ /CRITERIA = ALPHA(.05) /DESIGN = service agegrp gender service*agegrp service*gender agegrp*gender service*agegrp*gender . |
|
| Resources | Elapsed Time | 0:00:01.74 |
| Value Label | N | ||
|---|---|---|---|
| SERVICE | A | 277 | |
| F | 251 | ||
| N | 475 | ||
| AGEGRP | B | 5-14 | 16 |
| C | 15-17 | 10 | |
| D | 18-24 | 80 | |
| E | 25-34 | 237 | |
| F | 35-44 | 274 | |
| G | 45-64 | 292 | |
| H | 65 + | 94 | |
| GENDER | F | 444 | |
| M | 559 | ||
| SERVICE | AGEGRP | GENDER | Mean | Std. Deviation | N |
|---|---|---|---|---|---|
| A | 5-14 | F | 7.00 | .000 | 2 |
| M | 6.00 | . | 1 | ||
| Total | 6.67 | .577 | 3 | ||
| 15-17 | F | 6.00 | .000 | 2 | |
| M | 7.00 | .000 | 2 | ||
| Total | 6.50 | .577 | 4 | ||
| 18-24 | F | 6.08 | 1.240 | 12 | |
| M | 5.92 | 1.706 | 13 | ||
| Total | 6.00 | 1.472 | 25 | ||
| 25-34 | F | 5.62 | 1.522 | 29 | |
| M | 5.96 | .963 | 57 | ||
| Total | 5.85 | 1.183 | 86 | ||
| 35-44 | F | 4.79 | 2.245 | 24 | |
| M | 5.86 | 1.407 | 43 | ||
| Total | 5.48 | 1.812 | 67 | ||
| 45-64 | F | 5.93 | 1.880 | 27 | |
| M | 6.46 | .980 | 35 | ||
| Total | 6.23 | 1.453 | 62 | ||
| 65 + | F | 6.62 | .650 | 13 | |
| M | 5.82 | 1.629 | 17 | ||
| Total | 6.17 | 1.341 | 30 | ||
| Total | F | 5.72 | 1.754 | 109 | |
| M | 6.04 | 1.238 | 168 | ||
| Total | 5.91 | 1.468 | 277 | ||
| F | 5-14 | F | 7.00 | .000 | 2 |
| M | 7.00 | .000 | 3 | ||
| Total | 7.00 | .000 | 5 | ||
| 15-17 | F | 7.00 | . | 1 | |
| Total | 7.00 | . | 1 | ||
| 18-24 | F | 6.42 | 1.240 | 12 | |
| M | 5.17 | 1.329 | 6 | ||
| Total | 6.00 | 1.372 | 18 | ||
| 25-34 | F | 5.79 | 1.437 | 19 | |
| M | 5.83 | 1.642 | 23 | ||
| Total | 5.81 | 1.534 | 42 | ||
| 35-44 | F | 6.48 | .873 | 21 | |
| M | 6.38 | .661 | 42 | ||
| Total | 6.41 | .733 | 63 | ||
| 45-64 | F | 6.49 | 1.052 | 69 | |
| M | 6.58 | .663 | 33 | ||
| Total | 6.52 | .941 | 102 | ||
| 65 + | F | 6.80 | .561 | 15 | |
| M | 5.20 | 2.490 | 5 | ||
| Total | 6.40 | 1.429 | 20 | ||
| Total | F | 6.43 | 1.077 | 139 | |
| M | 6.22 | 1.152 | 112 | ||
| Total | 6.34 | 1.114 | 251 | ||
| N | 5-14 | F | 6.50 | .577 | 4 |
| M | 5.50 | 1.732 | 4 | ||
| Total | 6.00 | 1.309 | 8 | ||
| 15-17 | F | 6.67 | .577 | 3 | |
| M | 7.00 | .000 | 2 | ||
| Total | 6.80 | .447 | 5 | ||
| 18-24 | F | 5.15 | 1.281 | 13 | |
| M | 5.88 | 1.116 | 24 | ||
| Total | 5.62 | 1.210 | 37 | ||
| 25-34 | F | 6.23 | 1.165 | 40 | |
| M | 5.74 | 1.411 | 69 | ||
| Total | 5.92 | 1.341 | 109 | ||
| 35-44 | F | 5.95 | 1.380 | 44 | |
| M | 6.00 | 1.385 | 100 | ||
| Total | 5.99 | 1.379 | 144 | ||
| 45-64 | F | 6.12 | 1.343 | 67 | |
| M | 6.07 | 1.377 | 61 | ||
| Total | 6.09 | 1.354 | 128 | ||
| 65 + | F | 6.64 | .810 | 25 | |
| M | 5.84 | 1.500 | 19 | ||
| Total | 6.30 | 1.212 | 44 | ||
| Total | F | 6.12 | 1.267 | 196 | |
| M | 5.93 | 1.374 | 279 | ||
| Total | 6.01 | 1.333 | 475 | ||
| Total | 5-14 | F | 6.75 | .463 | 8 |
| M | 6.13 | 1.356 | 8 | ||
| Total | 6.44 | 1.031 | 16 | ||
| 15-17 | F | 6.50 | .548 | 6 | |
| M | 7.00 | .000 | 4 | ||
| Total | 6.70 | .483 | 10 | ||
| 18-24 | F | 5.86 | 1.337 | 37 | |
| M | 5.79 | 1.337 | 43 | ||
| Total | 5.83 | 1.329 | 80 | ||
| 25-34 | F | 5.93 | 1.363 | 88 | |
| M | 5.84 | 1.295 | 149 | ||
| Total | 5.87 | 1.318 | 237 | ||
| 35-44 | F | 5.76 | 1.679 | 89 | |
| M | 6.05 | 1.271 | 185 | ||
| Total | 5.96 | 1.420 | 274 | ||
| 45-64 | F | 6.25 | 1.348 | 163 | |
| M | 6.30 | 1.143 | 129 | ||
| Total | 6.27 | 1.260 | 292 | ||
| 65 + | F | 6.68 | .701 | 53 | |
| M | 5.76 | 1.655 | 41 | ||
| Total | 6.28 | 1.290 | 94 | ||
| Total | F | 6.12 | 1.374 | 444 | |
| M | 6.02 | 1.294 | 559 | ||
| Total | 6.06 | 1.331 | 1003 |
| Source | Type III Sum of Squares | df | Mean Square | F | Sig. | Partial Eta Squared |
|---|---|---|---|---|---|---|
| Corrected Model | 152.010(a) | 40 | 3.800 | 2.254 | .000 | .086 |
| Intercept | 7458.880 | 1 | 7458.880 | 4424.079 | .000 | .821 |
| SERVICE | 3.400 | 2 | 1.700 | 1.008 | .365 | .002 |
| AGEGRP | 36.198 | 6 | 6.033 | 3.578 | .002 | .022 |
| GENDER | 1.115 | 1 | 1.115 | .661 | .416 | .001 |
| SERVICE * AGEGRP | 37.734 | 12 | 3.145 | 1.865 | .035 | .023 |
| SERVICE * GENDER | 2.484 | 2 | 1.242 | .737 | .479 | .002 |
| AGEGRP * GENDER | 31.985 | 6 | 5.331 | 3.162 | .004 | .019 |
| SERVICE * AGEGRP * GENDER | 22.241 | 11 | 2.022 | 1.199 | .283 | .014 |
| Error | 1621.907 | 962 | 1.686 | |||
| Total | 38654.000 | 1003 | ||||
| Corrected Total | 1773.916 | 1002 | ||||
| a R Squared = .086 (Adjusted R Squared = .048) | ||||||