

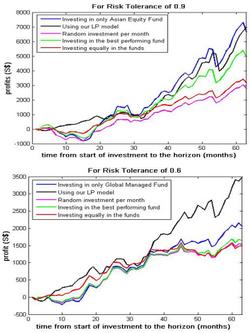
The above picture shows the results of the Portfolio Optimization model my colleague and I are working on as compared to some other ways that individual investors like myself uses when we try to invest in mutual funds.
For this test, we make use of the data we obtain from Prudential Singapore website of four of their funds, namely Global Bond (risk factor = 0.3), Global Managed (risk factor=0.6), Global Equity (risk factor=0.8), and Asian Equity (risk factor=0.9). We compare our model (black line) to four other ways:
1. Investing in only one fund throughout (from start till the horizon) - blue line.
2. Investing in a randomly selected fund - magenta line.
3. Investing in the best performing fund for the month - green line.
4. Investing in all the funds equally.
For this test, we put in a monthly investment of S$100 and an initial sum at the start of the investment of S$3000. Using our forecasting (with trend adjustment) model, we used the data collected from November 1998 to December 2001 to start our LP. Therefore the starting date of investment is January of 2002 and the horizon is at January of 2007.
We ran for risk tolerances of 0.9 and 0.6; to help ensure we took into account the risk tolerances, the LP model has the risk tolerance as an inequality constraint. For the other ways of investing, we chose funds which are either less than or equal to the risk tolerances as that would be realistic for investors to do. That means that for risk tolerance of 0.6, we are only using Global Bond and Global Managed Funds for the other four methods. Also we have not allowed for units to be sold for both the random method and the best performing fund strategy. The results for when units are allowed to be sold and reinvested for these two cases do not fare any better than when we do not allow for the units to be sold.
Looking at the results, our model did comparatively better than the other four methods as it showed greater profit than the random, best performing, and equal investment strategies. It did not perform as good as the fixed investment for risk tolerance of 0.9. This is due to the sudden increase in price of the Asian Equity within the last few years of the investment and the drop in price earlier in the investment period (resulting in greater number of units bought). Such a sudden increase in the price is difficult to predict at the earlier stages and the LP model would not have picked up the advantage of investing in the Asian Equity Fund at that stage.
Therefore, I contend that based on current and past information, our LP model worked as well as it could to predict as optimal a result as it could and fared better than the other kind of strategies other investors have used. We are not comparing our model to other optimization models which are out there in the market because we are aiming our model at individual investors who aren't likely to use such sophisticated models and ours is quite simple to understand and use for those who have Excel. Our model is easily set up in Excel.
Do give me your feedback on these results.
Thanks,
Sid