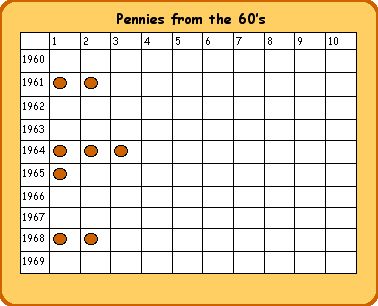
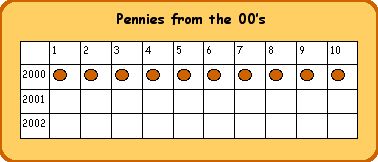
After we completed our bar graph, we turned to the computer to make picture graphs of our data by decades. Here is our work:
Total: 8
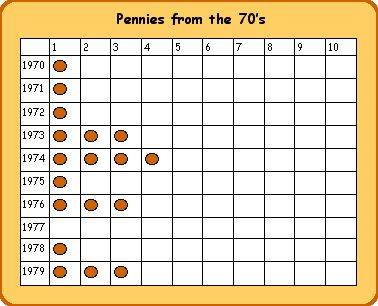
Total: 18
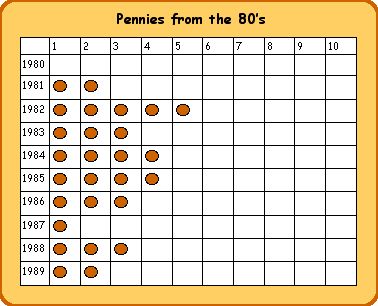
Total: 27
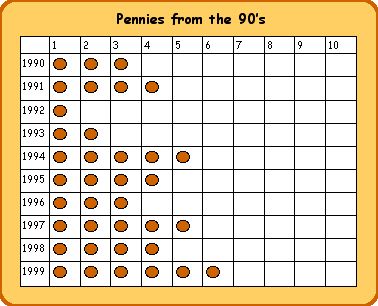
Total: 37
Total: 10
Back to Pennies Page
To Window to Our World