


Graph Goodies
We used our data collection from Jellybeans 2002 in a related project - Susan Silverman's Graph Goodies.
Susan has put together some terrific resources:
Math Links
Lesson Ideas
|
Graph Goodies We used our data collection from Jellybeans 2002 in a related project - Susan Silverman's Graph Goodies. Susan has put together some terrific resources: Math Links Lesson Ideas |
| Our Work | ||
|---|---|---|
For this project, we used some of our data from our Jellybeans 2002 project. We had four teams, each with a bag of jellybeans. We opened the bags, sorted by colors, and then decided how a bar graph could represent our data. Next we used a spreadsheet in Appleworks 6 to create circle or pie graphs. Below is the guiding question for our data collection and the graph from one of our Jellybean Teams (Team 4). What color jellybean do you find most often in packages of jellybeans? For this graph we used one bag of...  | ||
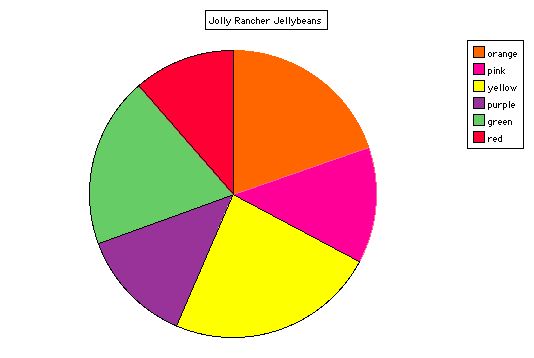 ~ QUESTIONS ~ 1. Which color had the greatest (largest) number? 2. Which color had the least (smallest) number of jellybeans? 3. Ms. Jacoby's favorite color jellybean is black. Should she buy this bag of jellybeans? After answering the questions, reward yourself with these: Jolly Rancher Fun and Games Graph Showcase See the great graphs and answer the questions in the Graph Goodies online graph book! | ||
|

