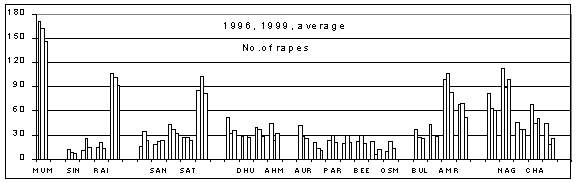
Out of the 30 districts, then existing,
only the districts of Ratnagiri, Kolhapur, Sangli, Nanded and Osmanabad have
not shown an increase during 1996. These are also the districts registering
a small number and a smaller rate of rapes. It should be a matter of more detailed study
by the police, the sociologists and the NGOs as to why the 1996 figures of
rape are so high. What new situations or trends came up then which resulted
in such a sharp increase in the number
of rapes?
The trend of sudden jump has started in 1995 itself. The districts of Mumbai, Thane, Nasik, Amravati registered very high increase compared to rape crimes committed during 1994.
The total number of rapes committed during the year 2000 is nearly 1400 which means that the number has once again reached the level of 1996. Alternatively, one may ask how the rapes registered during 96-97-98 show a gradual decline. See chart 2.
chart
1
|
district |
pop96 |
rape90 |
rape91 |
rape92 |
rape93 |
rape94 |
rape95 |
rape96 |
rape97 |
rape98 |
rape99 |
total |
Ave |
|
|
|
|
|
|
|
|
|
|
|
|
|
|
|
|
MUMBAI |
15000 |
107 |
114 |
104 |
131 |
160 |
234 |
171 |
150 |
136 |
162 |
1469 |
147 |
|
|
|
|
|
|
|
|
|
|
|
|
|
|
|
|
SINDHUDURG |
859 |
5 |
3 |
7 |
7 |
13 |
9 |
12 |
9 |
7 |
9 |
81 |
8 |
|
RATNAGIRI |
1633 |
8 |
9 |
18 |
17 |
17 |
14 |
11 |
13 |
18 |
26 |
151 |
15 |
|
RAIGAD |
2020 |
16 |
7 |
10 |
11 |
15 |
14 |
15 |
15 |
16 |
20 |
139 |
14 |
|
THANE |
6979 |
63 |
81 |
79 |
99 |
83 |
101 |
107 |
105 |
97 |
102 |
917 |
92 |
|
|
|
|
|
|
|
|
|
|
|
|
|
|
|
|
KOLHAPUR |
3295 |
25 |
29 |
22 |
14 |
25 |
24 |
16 |
22 |
32 |
34 |
243 |
24 |
|
SANGLI |
2422 |
33 |
23 |
27 |
19 |
24 |
25 |
18 |
23 |
23 |
22 |
237 |
24 |
|
SOLAPUR |
3595 |
21 |
21 |
29 |
33 |
29 |
34 |
43 |
30 |
41 |
36 |
317 |
32 |
|
SATARA |
2685 |
26 |
23 |
17 |
28 |
25 |
22 |
27 |
23 |
23 |
27 |
241 |
24 |
|
PUNE |
6389 |
48 |
63 |
82 |
83 |
85 |
92 |
86 |
72 |
91 |
103 |
805 |
81 |
|
|
|
|
|
|
|
|
|
|
|
|
|
|
|
|
NASHIK |
4384 |
26 |
29 |
23 |
30 |
36 |
44 |
52 |
35 |
40 |
32 |
347 |
35 |
|
DHULE |
2818 |
18 |
19 |
22 |
26 |
42 |
25 |
29 |
41 |
18 |
30 |
270 |
27 |
|
JALGAON |
3515 |
22 |
15 |
12 |
20 |
48 |
27 |
40 |
44 |
22 |
38 |
288 |
29 |
|
AHMEDNAGAR |
3757 |
22 |
28 |
32 |
35 |
43 |
31 |
44 |
33 |
31 |
24 |
323 |
32 |
|
|
|
|
|
|
|
|
|
|
|
|
|
|
|
|
AURANGABAD |
2161 |
12 |
26 |
25 |
23 |
27 |
28 |
42 |
26 |
25 |
28 |
262 |
26 |
|
JALNA |
1567 |
4 |
0 |
6 |
8 |
8 |
6 |
21 |
22 |
22 |
14 |
111 |
11 |
|
PARBHANI |
2400 |
11 |
14 |
12 |
18 |
17 |
29 |
24 |
27 |
22 |
30 |
204 |
20 |
|
NANDED |
2684 |
11 |
18 |
16 |
28 |
22 |
27 |
19 |
31 |
12 |
30 |
214 |
21 |
|
BEED |
2065 |
8 |
11 |
21 |
14 |
23 |
13 |
23 |
27 |
15 |
30 |
185 |
19 |
|
LATUR |
1907 |
5 |
7 |
14 |
5 |
13 |
10 |
22 |
18 |
15 |
6 |
115 |
12 |
|
OSMANABAD |
1419 |
11 |
3 |
17 |
14 |
23 |
16 |
10 |
12 |
12 |
23 |
141 |
14 |
|
|
|
|
|
|
|
|
|
|
|
|
|
|
|
|
BULDHANA |
2106 |
26 |
11 |
15 |
35 |
36 |
23 |
37 |
28 |
20 |
27 |
258 |
26 |
|
AKOLA |
2435 |
23 |
17 |
25 |
33 |
33 |
31 |
43 |
24 |
29 |
30 |
288 |
29 |
|
AMRAVATI |
2390 |
68 |
51 |
58 |
74 |
89 |
109 |
100 |
87 |
73 |
106 |
815 |
82 |
|
YAVATMAL |
2270 |
26 |
37 |
43 |
52 |
72 |
54 |
69 |
45 |
57 |
70 |
525 |
53 |
|
|
|
|
|
|
|
|
|
|
|
|
|
|
|
|
BHANDARA |
2256 |
46 |
42 |
60 |
56 |
78 |
63 |
81 |
72 |
50 |
63 |
611 |
61 |
|
NAGPUR |
3718 |
72 |
89 |
97 |
103 |
107 |
134 |
112 |
92 |
92 |
89 |
987 |
99 |
|
WARDHA |
1144 |
35 |
30 |
32 |
36 |
37 |
30 |
46 |
30 |
53 |
38 |
367 |
37 |
|
CHANDRAPUR |
1980 |
47 |
47 |
46 |
62 |
45 |
45 |
69 |
48 |
45 |
44 |
498 |
50 |
|
GADCHIROLI |
874 |
24 |
27 |
17 |
23 |
22 |
41 |
45 |
33 |
12 |
18 |
262 |
26 |
|
|
|
|
|
|
|
|
|
|
|
|
|
|
|
|
ALL MAHA |
92727 |
869 |
898 |
988 |
1137 |
1297 |
1355 |
1434 |
1237 |
1149 |
1311 |
11675 |
1168 |
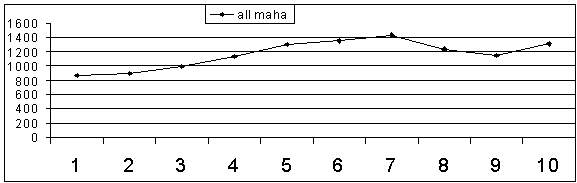
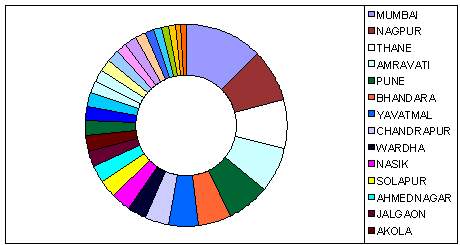
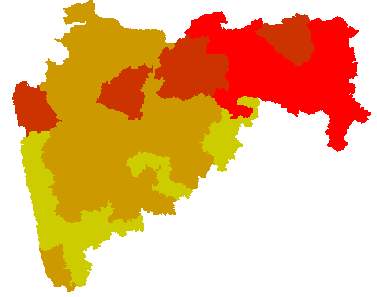
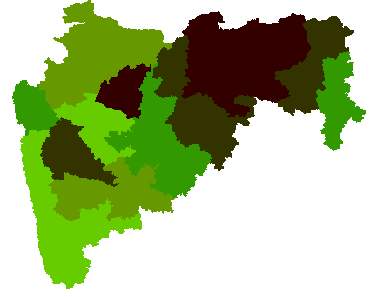
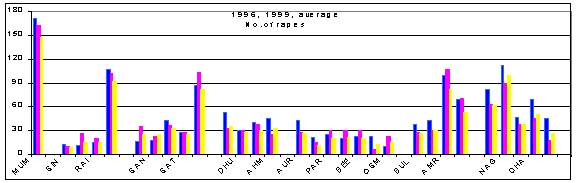
Chart 3 below is a graphical depiction
of the rate of rapes committed in 1996, the 10-year average and the rate of
rapes committed in 1999.
chart 3
The
above analysis speaks of rape cases in terms of absolute numbers.
It can facilitate the government to decide upon the quantum of deployment
of suitable investigative machinery, police personnel, computerization, better
forensic facility, higher budget, closer monitoring, etc. in problem districts.
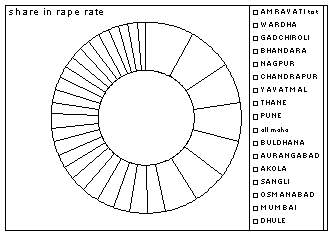
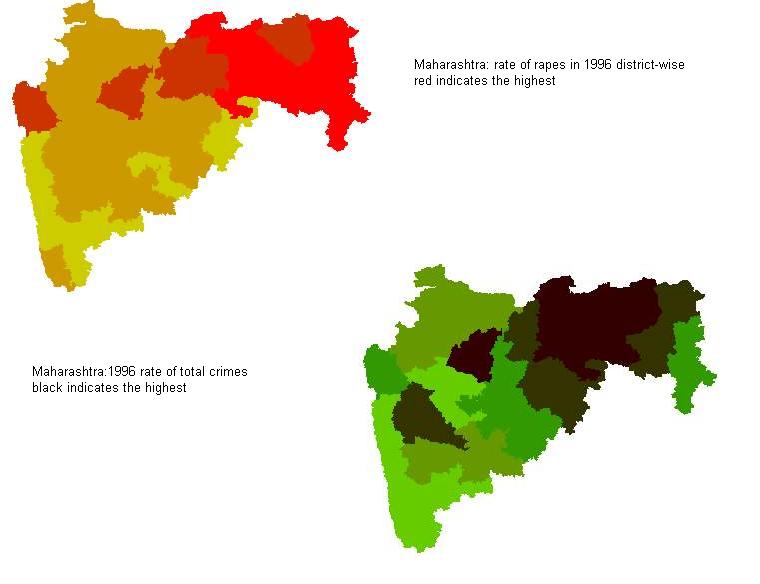
A sociologist, however, is concerned more with the rate of
crimes. Different districts have smaller or bigger
geographical area and higher or lower population. Hence for a comparison, rate of crime provides a different variety
of indicators. A district having lower
population but higher number of rapes, is definitely a bigger problem to the
sociologists and they need to investigate the reasons for higher criminal
mentality.
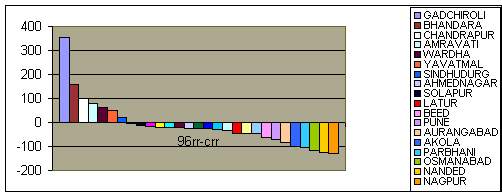
3. Crime
rate
Chart
4 here shows the rate of rapes per crore population during the 1995 to
1999.
Chart
4
|
district |
95% |
96% |
97% |
98% |
99% |
av rate 10 |
|
|
|
|
|
|
|
|
|
|
|
MUMBAI |
156 |
114 |
100 |
91 |
108 |
98 |
|
|
|
|
|
|
|
|
|
|
|
SINDHUDURG |
105 |
140 |
105 |
81 |
105 |
93 |
|
|
RATNAGIRI |
86 |
67 |
80 |
110 |
159 |
92 |
|
|
RAIGAD |
69 |
74 |
74 |
79 |
99 |
69 |
|
|
THANE |
145 |
153 |
150 |
139 |
146 |
132 |
|
|
|
|
|
|
|
|
|
|
|
KOLHAPUR |
73 |
49 |
67 |
97 |
103 |
73 |
|
|
SANGLI |
103 |
74 |
95 |
95 |
91 |
99 |
|
|
SOLAPUR |
95 |
120 |
83 |
114 |
100 |
89 |
|
|
SATARA |
82 |
101 |
86 |
86 |
101 |
89 |
|
|
PUNE |
144 |
135 |
113 |
142 |
161 |
127 |
|
|
|
|
|
|
|
|
|
|
|
NASHIK |
100 |
119 |
80 |
91 |
73 |
80 |
|
|
DHULE |
89 |
103 |
146 |
64 |
106 |
96 |
|
|
JALGAON |
77 |
114 |
125 |
63 |
108 |
83 |
|
|
AHMEDNAGAR |
83 |
117 |
88 |
83 |
64 |
85 |
|
|
|
|
|
|
|
|
|
|
|
AURANGABAD |
130 |
194 |
120 |
116 |
130 |
120 |
|
|
JALNA |
38 |
134 |
140 |
140 |
89 |
70 |
|
|
PARBHANI |
121 |
100 |
113 |
92 |
125 |
83 |
|
|
NANDED |
101 |
71 |
115 |
45 |
112 |
78 |
|
|
BEED |
63 |
111 |
131 |
73 |
145 |
92 |
|
|
LATUR |
52 |
115 |
94 |
79 |
31 |
63 |
|
|
OSMANABAD |
113 |
70 |
85 |
85 |
162 |
99 |
|
|
|
|
|
|
|
|
BULDHANA |
|
| -size:10.0pt;font-family:Arial;
mso-bidi-font-family:"Times New Roman";color:black'>109 |
176 |
133 |
95 |
128 |
123 |
||
|
AKOLA |
127 |
177 |
99 |
119 |
123 |
119 |
|
|
AMRAVATI tot |
456 |
418 |
364 |
305 |
444 |
343 |
|
|
YAVATMAL |
238 |
304 |
198 |
251 |
308 |
233 |
|
|
|
|
|
|
|
|
|
|
|
BHANDARA |
279 |
359 |
319 |
222 |
279 |
270 |
|
|
NAGPUR |
360 |
301 |
247 |
247 |
239 |
266 |
|
|
WARDHA |
262 |
402 |
262 |
463 |
332 |
323 |
|
|
CHANDRAPUR |
227 |
349 |
242 |
227 |
222 |
253 |
|
|
GADCHIROLI |
469 |
515 |
378 |
137 |
206 |
297 |
|
|
|
|
|
|
|
|
|
|
|
all maha |
146 |
155 |
133 |
124 |
141 |
126 |