|
Trend Trading - Spotting The Ideal Entry/Exit
week-ending 05-02-2005 'snapshot' of the global market in gold
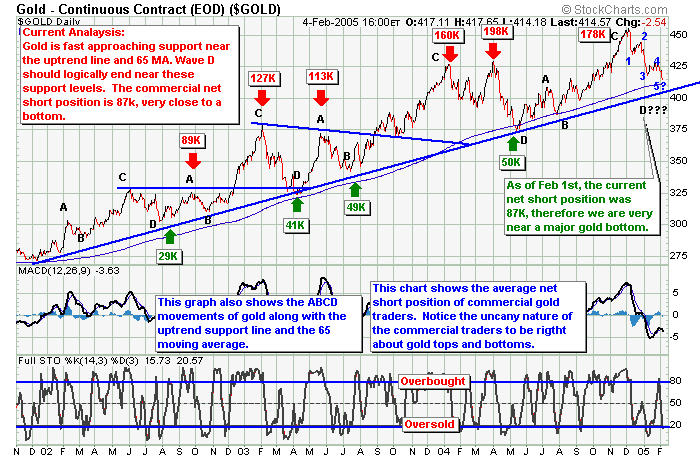 Above
is illustrated, that now (or very soon), is the time to buy gold on the world
market as it rebounds
from 65 week moving average and uptrend lines; with a view to selling at the
next high when commercial net short positions peak. "The trend is
(indubitably) your friend"!
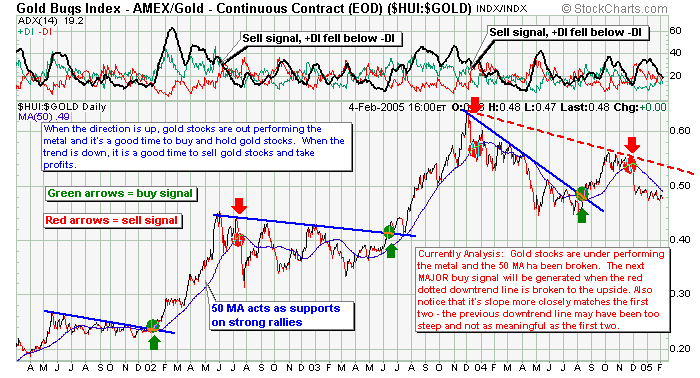
Below is illustrated one method of timing the
trend indicated (sometimes corroborated for the citizen trader by low commercial net short sellers' positions) move,
this date *into* gold -
as a better timing signal that prayer or guesswork, we're waiting for a positive price cross of the 50 moving average, plus a rise in ADX, plus
a positive cross of +ve DI over -ve DI.
The trading environment is enabled by applied computing technologies
and the lesson is by SoACT's
paradigm shift project team.
Next lesson : 'how to trade' the prime Asante natural resource
(over the heads of its crony capitalist neo-colonial South African/London
'owners', and their contemptible local stooges).
Below is a trend based strategy for currency crosses when (and only when)
they exhibit a trending tendency.
The Criteria: After the pair/cross above both moving averages (MAs)
for a prolonged period of time you can screen to the next criteria. Draft a
channel set at 2 standard deviations over the price data to test if the
trend is valid. How does one know if the channel is valid? When 95% of
pricing trades within both bands the channel is then considered valid.
Once the criterion has been confirmed, you apply a 10 and 20-day SMA to the
price chart to establish the entry and stop loss price. As time passes you
will notice the gap between the two MAs "wash" to and fro as they oscillate
behind the price. When the two become relatively close to one another, you
have an ideal entry situation.
The Trigger When the two MAs begin to converge you place entry orders
at and below the 10-day SMA, laddering to halfway between the two. For
example: if the 10-day SMA was at 1.3220 and the 20-day SMA is at 1.3100 you
would place one order at 1.3220 and another at 1.3160. If the price dips
into your entry orders you place a stop about the size of the spread of the
instrument you are trading below the 20-day SMA. In the case of the EUR/USD
that would be 3-pips or at 1.3097. If you are trading a cross with a larger
spread, that gap would increase accordingly. Below is a recent example of
this strategy on the GBP/USD.
Notice as the price converged if you had set orders at and half way between
the distance of the MAs, you would have had various opportunities at a very
profitable trade.
Trading this strategy is ideal using the FX Trading Station by FXCM since
there are no limitations for short trades (such as equities where you must
short on an uptick) and the built-in trailing stop feature allows you to
participate in the trade with out watching every tick.
|
![[24 hr gold spot]](http://www.kitconet.com/images/live/s_gold.gif)
![[24 hr gold price]](http://kitconet.com/charts/metals/gold/t24_au_xx_usoz_4.gif)
![[Most Recent XAU quotes]](http://kitconet.com/charts/xau/idx24_xau_en_2.gif)
![[24 hr silver spot]](http://www.kitconet.com/images/live/s_silv.gif)
