TOWARDS A BALANCED ENERGY
STRATEGY
HYDROGEN FROM COAL TO REPLACE GASOLINE
ABSTRACT
World
over, consumption of energy resources is disproportionate to the known
reserves. Even though coal accounts for
more than 90 percent of the known fossil energy sources, its share in meeting
the energy needs is significantly low.
Any deliberate attempt to increase the use of coal will be met with
economic constraints controlled by environmental considerations. On the other
hand, it is well recognized that hydrogen, with its zero emission potential, is
the ultimate energy source. Absence of
free hydrogen source and want of economical way to derive it from water is
holding its domination on the energy scene.
Technological developments are however, being pursued towards this end
of hydrogen based energy scenario. Such
efforts can be complemented and hastened by operating all conventional steam
cycle power plants to their full capacity and make use of surplus power to generate
hydrogen for use as transportation fuel.
By such a practice, it is observed that additional 620 million megawatt hour energy generation is annually possible by operating 335 plants situated in 42 states to 85 percent capacity. This is equivalent to 340 million barrels of oil on the basis of 75 percent conversion efficiency for hydrogen generation. In 15 states the oil replacement capacity can exceed 10 million barrels. Oil replacement potential will proportionately increase by increasing capacity utilization (some plants are run at 98%) and improving conversion efficiency (90% is possible with solid polymer electrolytes). Additional 38 percent oil replacement value is possible. While toxic emissions from automobile exhaust can be eliminated totally, the net generation of carbon dioxide will apparently increase. Such an increase is however be comparable to other means of using coal for hydrogen generation. More importantly, its generation will be restricted to a few locations as against thinly dissipating the same all over the country by way of automobile exhaust. This would enable application of any carbon sequestration process very practical.
_____________
Environmental considerations in terms of restricting emissions of carbon dioxide and oxides of sulfur and nitrogen have relegated lowest priority to abundant coal as a primary energy source over the much scarce oil & natural gas. It has also been realized that hydrogen, with its apparent zero emissions potential, is undoubtedly the future source of energy. But, the absence of a free source of hydrogen and the unfavorable economics of its large-scale production from water is holding the shift in energy usage pattern. At the same time, significant technological developments are being made in the recent years on various aspects of hydrogen generation, storage, transportation and use. Specific efforts relate to hydrogen as the fuel to run internal combustion engines as well as automobiles run by fuel cells based on hydrogen. Widespread use of hydrogen for transportation only can make a visible impact on the environment. This is particularly true with developed countries. Leading example is the United States America. A study has been made to improve the prevailing situation by increasing the use of abundant coal as a primary energy source at the same time hasten the switch over to hydrogen as an end-use-energy-source specifically for transportation. This strategy is proposed towards a balanced use of primary energy resources.
Technical feasibility of using
hydrogen as a transportation fuel is known from the world war times1. Not only has it been demonstrated to
efficiently run internal combustion engines on hydrogen even commercial
aviation was practiced. Much research
& development has taken place since then.
A Department of Energy (DOE) sponsored survey carried out by the
National Renewable Energy Laboratory (NREL),2 summarizes the status
of the economics of hydrogen
production, storage, transport, and end-use technologies.
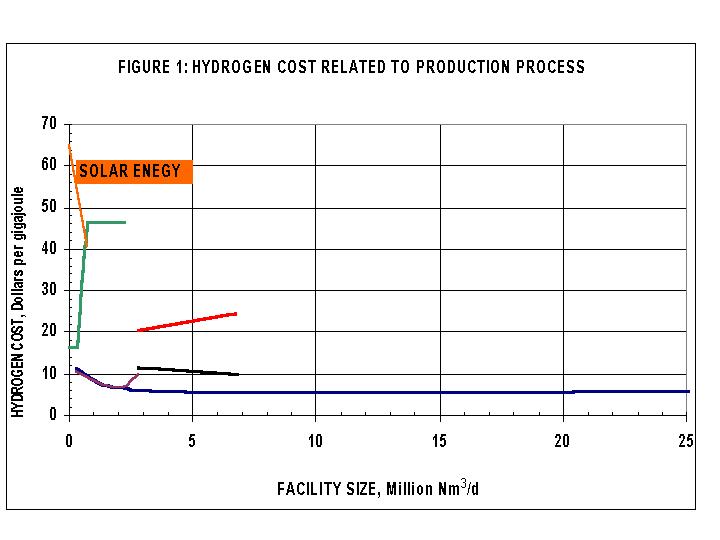
Based on the information contained in the DOE report cost of hydrogen produced by different processes is compared. Figure 1 gives the cost in dollars per giga-joule and as a function of production capacity. The cheapest process today is steam or non-catalytic oxidation of methane for which the raw material is natural gas. The present analysis however relates to the use of abundant coal in the absence of scarce petroleum feed stock or natural gas. Options left then are to use of coal through gasification route or the electrolysis of water. The latter roughly costs twice the former. But, to the extent already installed capacity can be made use of for the production of electricity that much additional capital for the expensive gasification plants need not be sought.
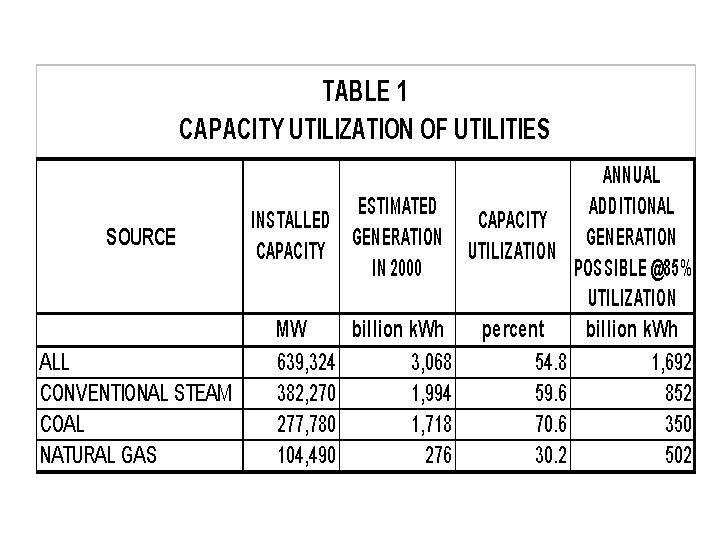
The installed capacity of the Utilities as of the year 1999 was 639,324 MW (Table 1) 3. Conventional steam generating plants account for 382,270 MW, of which exclusively coal-based plants alone has the potential to provide 277,780 MW. The balance has dual provision for coal, gas or oil. The estimated power generation during the year 2000 from the steam based plants is 1994 billion kWh. This accounts for 60% of the installed capacity. The low capacity utilization is mostly due to demand fluctuations in a year, since the power once generated has to be consumed. However, if these plants are run to their capacity, the surplus power generated can be used to produce hydrogen for use as transportation fuel. By such a practice, petroleum products can be conserved to some extent. Even though there would be a net increase in the quantity of carbon-dioxide emission, its generation will be localized effectively to a fewer points as against thinly dissipating its emission over the entire country by way of automobile exhaust. Thus, it will be more practical to effectively implement carbon sequestration technologies when fully established.
By increasing the electricity generation from the current 60% of the conventional steam based plants to 85% the surplus power available is of the order of 850 billion kWh. Theoretically, 94 kWh (of which 79 kWh is required as electrical energy) makes 1,000 ft3 of hydrogen4. Assuming a process efficiency of 75% for the conventional electrolytic units, 1,000 ft3 of hydrogen requires 106 kWh of electricity and an additional 24 kWh as heat. A unit weight of hydrogen is equivalent to 2.58 weight of gasoline. 100 billion kWh of energy is equivalent to 55 million barrels of transportation fuel at 75% conversion efficiency (Appendix A). Thus, 850 billion kWh can provide 455 million barrels or 1.28 million barrels per day (MMBD) of petroleum fuel. This is 15% of the current motor gasoline consumption or roughly, 60% of the diesel fuel used by the trucks in the country.
This estimated petroleum fuel replacement could further be enhanced by (a) operating coal-based plants beyond 85% capacity and (b) use of advanced solid polymer electrolyte with which the conversion efficiency of upto 90% for hydrogen generation is expected. Thus, additional 38% of petroleum fuels can be conserved if power plants are run to 98 percent capacity.
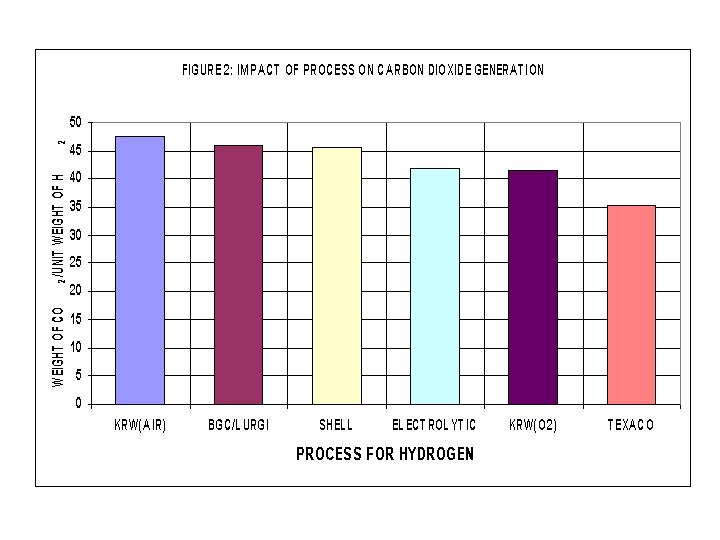
Substitution of petroleum fuels by hydrogen generated through augmentation of unused steam generation capacity eliminates toxic emissions from road vehicles altogether. Apparently, there would be an increase in the quantum of carbon dioxide emitted. But, at the same time it is important to note that specific generation of carbon dioxide, weight per weight of hydrogen obtained, is comparable to other processes to get hydrogen from coal5. This is seen in Figure 2. Further, in the changed scenario, the points of carbon dioxide emissions would be restricted to a few in number from thousands spread allover the country. Hence, the application of any technology to sequester carbon dioxide becomes more feasible.
With this proposition of using the unused capacity of the power plants to generate hydrogen there is an option to set up electrolytic plants within power station limits and transport hydrogen or at independent locations convenient for distribution to consumer points. For the later case, network already exists for the transmission of power.
Further, ready availability of hydrogen at a coal based power plant will open another avenue to use hydrogen as a reducing agent to contain NOx. An evaluation of its technical feasibility and economic viability in comparison with the process of Selective Catalytic Reduction (SCR) would be an interesting proposition.
These encouraging aspects of hydrogen cogeneration in steam based conventional power plants towards environmental safeguard, prompts establishing demonstration pilot projects. Such a step will be a forerunner to wide spread usage of hydrogen as fuel in the future and will complement development of fuel cell based vehicles. This can be in the first instance being in some exclusively coal-based power plants where sufficient spare capacity is available. In this context, a detailed analysis of the performance of 450 utilities based fully or partly on coal during the years 1997 & 1999 reveals the following6. Additional annual energy generation possible from among 335 plants situated in 42 states is 620 million MWh assuming these plants are run to 85% capacity utilization. This is equivalent to 390 million barrels of oil on the basis of considerations detailed above at 75 percent conversion efficiency. In 15 of these states oil replacement capacity exceeds 10 million barrels (Appendix B). Hydrogen plant capacity linked to these plants mostly below 5 million Nm3 per day with median around 3. This is well within the established designs of electrolytic plants (Ref. Fig 1). Oil replacement potential will proportionately increase by increasing capacity utilization (some plants are run at 98%) and improving conversion efficiency (90% is possible with solid polymer electrolytes).
CONCLUSIONS: Operating all the conventional steam cycle power pants in the country to full capacity and using the surplus electricity to generate hydrogen to substitute some petroleum fuels for transportation is feasible. A step in this direction would initiate the use of coal to substitute oil and pave way to commercial use of hydrogen as end-use-energy-source.
|
APPENDIX A |
|||
|
A.1: Estimated primary
energy consumption in 2000 |
|||
|
|
Quadrillion
Btu |
Percent |
|
|
A.1.1: Petroleum
products in million barrels per day (MMBD) |
|
|
|
|
Motor gasoline |
19.6 |
16.236 |
16.46 |
|
Other Oils |
8.4 |
9.664 |
9.80 |
|
Distillate Fuel Oil |
3.7 |
7.152 |
7.25 |
|
Jet Fuel |
1.7 |
3.286 |
3.33 |
|
Residential Fuel Oil |
0.78 |
1.508 |
1.53 |
|
Sub Total |
34.18 |
37.846 |
38.37 |
|
(Consumption of diesel for
truck transportation) |
4.9 |
9.471 |
9.60 |
|
A.1.2: NATURAL GAS
(trillion cubic ft of dry gas) |
|
|
|
|
|
22.2 |
22.953 |
23.27 |
|
A.1.3: COAL (million
short tons per year) |
|
|
|
|
Utilities |
943.2 |
19.645 |
19.92 |
|
Rest |
104.8 |
2.183 |
2.21 |
|
Sub Total |
1048 |
21.828 |
22.13 |
|
A.1.4: NUCLEAR (billion
kWh) |
|
|
|
|
|
739 |
7.898 |
8.01 |
|
A.1.5: RENEWABLES (billion
kWh) |
|
|
|
|
|
772 |
8.099 |
8.21 |
|
Total |
98.624 |
100.00 |
|
|
A2: Electricity generation |
|
|
|
|
Total installed capacity |
Gigawatts |
639.324 |
|
|
Coal based |
Gigawatts |
274.9093 |
|
|
Estimated total
generation, billion kWh |
Billion kWh |
3,785 |
|
|
Utilities |
Billion kWh |
3,068 |
|
|
Coal |
Percent |
56 |
|
|
Nuclear |
Percent |
24 |
|
|
Natural gas |
Percent |
9 |
|
|
Hydropower |
Percent |
9 |
|
|
Oil |
Percent |
2 |
|
|
A.3: Computations |
|||
|
During the year 2000, 56% of
3,068 billion kWh electricity generated was from coal; Installed utility
capacity (1999) 639.324 gigawatts; Capacity utilization |
percent |
71.3 |
|
|
90% of the 1,048 million
tons of coal was consumed by the utilities to produce 1,718 billion kWh
electricity; Specific rate of coal consumption |
kWh per short ton |
1821.459 |
|
|
Theoretically, 79 kWh
electriity and 15 kWh energy in the form of heat is required to obtain 1000
ft3 of hydrogen; @ 75% conversion efficiency. Therfore, 100 kWh electricity can provide
hydrogen |
ft3 |
1000 |
|
|
or |
lbs |
5.57 |
|
|
As transportation fuel,
1kg of hydrogen covers 30 km, whereas 1 kg of gasoline covers 11.6 km; Thus,
1 unit weight of hydrogen is equivalent to 2.58 unit weight of gasoline. On an average, 1 gallon of gasoline is
6.15 lbs. Therfore, 5.57 lbs hydrogen |
gasoline |
2.337 |
|
|
250 billon kWh electricity
can substitute gasoline |
billon gallons |
5.8425 |
|
|
@ 42 gallons per barrel |
billion barrels |
0.139107 |
|
|
or daily rate of
availability |
million barrels |
0.381115 |
|
|
APPENDIX B |
|||||||||||
|
STATEWISE POTENTIAL FOR PETROLEUM PRODUCT SUBSTITUTION |
|||||||||||
|
SL NO. |
STATE |
INSTALLED CAPACITY |
TOTAL PLANTS |
ADDITIONAL ENERGY POSSIBLE @ 85% UTILIZATION |
REPACEMENT PETROLEUM FUEL |
SL NO |
STATE |
INSTALLED CAPACITY |
TOTAL PLANTS |
ADDITIONAL ENERGY POSSIBLE @ 85% UTILIZATION |
REPACEMENT PETROLEUM FUEL |
|
MW |
NO. |
MWhe |
BARRELS |
MW |
NO. |
MWhe |
BARRELS |
||||
|
1 |
PA |
22,184 |
23 |
56,406,690 |
31,023,679 |
23 |
SC |
5,276 |
9 |
11,090,233 |
6,099,628 |
|
2 |
IL |
17,573 |
24 |
54,026,447 |
29,714,546 |
24 |
OK |
5,934 |
5 |
8,989,495 |
4,944,222 |
|
3 |
OH |
24,447 |
28 |
52,048,616 |
28,626,739 |
25 |
NY |
4,276 |
13 |
8,217,837 |
4,519,810 |
|
4 |
IN |
22,887 |
28 |
50,091,632 |
27,550,398 |
26 |
AZ |
6,338 |
6 |
8,186,501 |
4,502,575 |
|
5 |
GA |
15,679 |
12 |
46,132,534 |
25,372,893 |
27 |
DE |
1,511 |
2 |
6,148,924 |
3,381,908 |
|
6 |
MI |
14,571 |
21 |
33,864,974 |
18,625,735 |
28 |
MA |
2,552 |
3 |
4,842,105 |
2,663,158 |
|
7 |
KY |
16,772 |
22 |
30,194,655 |
16,607,060 |
29 |
CO |
5,197 |
14 |
4,839,175 |
2,661,546 |
|
8 |
MO |
12,619 |
20 |
27,826,138 |
15,304,376 |
30 |
NE |
3,168 |
7 |
4,759,847 |
2,617,916 |
|
9 |
MD |
8,079 |
7 |
27,159,122 |
14,937,517 |
31 |
WY |
6,075 |
9 |
4,727,458 |
2,600,102 |
|
10 |
FL |
13,173 |
11 |
27,080,289 |
14,894,159 |
32 |
AK |
3,993 |
5 |
4,540,006 |
2,497,003 |
|
11 |
AL |
13,412 |
9 |
26,729,037 |
14,700,970 |
33 |
MS |
2,451 |
3 |
4,237,221 |
2,330,472 |
|
12 |
TN |
11,814 |
7 |
26,392,724 |
14,515,998 |
34 |
ND |
4,295 |
7 |
3,804,372 |
2,092,405 |
|
13 |
NC |
13,282 |
14 |
26,144,699 |
14,379,584 |
35 |
NV |
2,770 |
3 |
3,803,425 |
2,091,884 |
|
14 |
VA |
8,186 |
9 |
24,794,199 |
13,636,810 |
36 |
NM |
4,295 |
4 |
3,649,410 |
2,007,175 |
|
15 |
WV |
14,977 |
13 |
19,408,497 |
10,674,673 |
37 |
WA |
1,510 |
2 |
2,780,433 |
1,529,238 |
|
16 |
MN |
5,859 |
16 |
15,466,825 |
8,506,754 |
38 |
MT |
2,514 |
3 |
2,427,962 |
1,335,379 |
|
17 |
TX |
20,131 |
17 |
14,553,170 |
8,004,244 |
39 |
NH |
2,030 |
3 |
2,186,865 |
1,202,776 |
|
18 |
NJ |
2,770 |
5 |
12,786,635 |
7,032,649 |
40 |
CT |
679 |
1 |
1,923,879 |
1,058,134 |
|
19 |
IA |
6,126 |
19 |
12,560,258 |
6,908,142 |
41 |
SD |
612 |
2 |
939,248 |
516,586 |
|
20 |
WI |
7,515 |
17 |
12,203,254 |
6,711,790 |
42 |
OR |
561 |
1 |
613,134 |
337,223 |
|
21 |
KS |
5,940 |
9 |
12,078,264 |
6,643,045 |
ALL |
283,149 |
335 |
619,786,304 |
340,882,467 |
|
|
22 |
LA |
5,154 |
4 |
11,837,646 |
6,510,705 |
||||||
Technologies” National Renewable Energy
Laboratory, (1999)
3. California Energy Comission, “1999 Electricity Generation Emissions Report (A Report to the Legislature)”, (1999)
About the Author: Dr. Kotur S. Narasimhan was the Director of Central Fuel Research Institute (CFRI), Dhanbad, India during 1992 - 1998. Earlier, He was a scientist at the Regional Research Laboratory, Bhubaneswar (RRL-B), India. Both CFRI and RRL-B are the constituent laboratories of the Council of scientific & Industrial Research, Government of India. He has more than 100 research publications to his credit and edited several monographs and symposium proceedings. His current interests are Energy, Environment and Economics applied to use of coal and mineral resources.