The purpose of this project was to grind and polish a high quality elescope mirror by hand, accurate to within one-eighth of a wavelength of light. First, I had to grind the mirror to the correct radius of curvature. Then, after polishing it, I figured it to the correct parabola. Figuring it involved polishing it with certain strokes of the tool on the mirror, followed by testing the shape with a knife edge test or a Ronchi test. Each cycle of figuring and testing could be considered individual experiments, the hypothesis being that the mirror has the correct shape. If that hypothesis was wrong, I would continue the cycle of figuring and testing until the hypothesis was correct. Finally, I was successful and the mirror attained a good parabola. I would like to acknowledge the help of my father and the experienced telescope makers at Chabot Observatory for their help with the testing of the figure of the mirror.
In my pursuit of astronomy I decided to build a telescope, including grinding the mirror by hand. The type that I wanted to make is called a Dobsonian, and it is patterned after Newtonian telescopes. It consists of a primary mirror, a smaller secondary mirror, an eyepiece, a tube that it all fits in, and a rocker box which allows the tube to swivel and pivot in order to point it at various parts of the sky. See Figure 1, Diagram of a Dobsonian Telescope. Light from stars enters the tube at the top and reflects off the primary mirror at the bottom. It then reflects off the secondary mirror, which is at an angle to reflect the light into the eyepiece where the observer looks through. See Figure 2, Diagram of a Newtonian Telescope. The primary mirror must be parabolic in order for the parallel light rays to converge properly at the focus point. See Figure 3, Light Rays on a Parabolic Mirror. Although it is nearly impossible to make a mirror an exact parabola, it must be accurate to within an eighth of a wavelength of light so that the image of the star is not smeared.
I found several books that had good information about grinding and polishing a mirror. Since this is the first mirror I have made, I needed to know how to grind, polish, and test it. Sam Brown's book, All About Telescopes, has the basic information that I needed to begin my mirror. I also used Jean Texereau's How to Make a Telescope, which has a lot about testing the mirror. I found more extensive information about testing and figuring in the Standard Handbook for Telescope Making, by Neale E. Howard. I took the equations that I used for graphing my data from an issue of Telescope Making. This research was critical because I needed to know exactly what to do to make my telescope mirror.
The point of my project is to make a telescope mirror by hand that is at least as good optically as a professionally made one. My recurring hypothesis is that the mirror is good enough. This is a cyclical experiment where if the hypothesis is proved wrong, I continue the experiment and testing until the hypothesis is correct.
The most complex and scientifically involved part of making a telescope mirror comes at the end during the figuring and parabolizing, but it is necessary to describe how to get to that point. The first step in making a mirror is rough grinding to the initial shape, followed by fine grinding to smooth out the surface. After that, one must make the pitch lap and polish the mirror with it. At the end, the mirror must be tested and figured until it achieves a parabola.
My mirror is a circular piece of Pyrex (borosilicate glass) 152 millimeters in diameter and 25 millimeters thick. The tool that I used to grind it is a circular piece of plate glass with the same diameter. I learned the basic method of grinding in Sam Brown's book, All About Telescopes. I secured the tool with cleats on a table and placed the mirror face down on top of it with #80 silicon carbide grit and water in between. Putting pressure on the mirror, I moved it forward and back on the tool, periodically turning the tool one direction and the mirror the other to ensure that the wear on the mirror was uniform. The natural arching motion of the hands makes the mirror on top concave and the tool on the bottom convex. When the grit wore down, I would rinse off the excess and put more grit and water on to grind further. I worked nearly seven hours with the #80 grit until the mirror was dished enough. I measured the amount that the mirror was dished by placing a drill bit, whose diameter was the same as the amount that the mirror needed to be dished, in the middle of the mirror and placing a ruler across the top to see if the mirror was dished enough. Such a direct measurement of the focal length could only be made during the rough grinding because the precision needed later requires the focal length to be measured indirectly.
For fine grinding I followed the same procedure with finer grit, but I alternated the mirror and the tool being on top so that the focal length would not change. The finer grits I used, in order, are: #180, 240, and 340 silicon carbide, and #40, 20, and 7 aluminum oxide. With the silicon carbide, the larger numbers mean that the grit is finer grain, but the aluminum oxide uses a different numbering system where the smaller numbers mean that the grit is finer grain. I inspected the surface of the mirror with a magnifying glass to see if there were any unusually deep pits in it before moving on to the next smaller grit. If there were, I would continue with the current grit until the surface was uniform. To test the focal length of the mirror, on a sunny day I wet the surface to make it shiny and reflected the sun's image onto the eaves of my house. I then measured the distance from the mirror to the eaves when the image of the sun was sharpest.
After the fine grinding, the mirror must be polished, but this requires a pitch lap instead of the plate glass tool. I made my pitch lap at the mirror-making workshop at Chabot Observatory, where I had also received advice on fine grinding and polishing. To make a pitch lap, I put masking tape around the perimeter of the tool, creating a dam around it. Then I poured melted pitch onto the tool, let it cool slightly, and cut perpendicular channels in it. See Figure 4, Making a Pitch Lap. I let it sit with the mirror on top so that the pitch would conform to the curve of the mirror. Pitch is needed for polishing because it stays hard on the short term, but it slowly flows over time so that it always keeps the same curve as the mirror. The channels are to allow any air bubbles to escape that may have gotten trapped in the pitch.
Polishing is very similar to grinding. However, I had to periodically set the mirror face down on the pitch lap for hours at a time, placing some weight on top so that they would press together and make the pitch conform to the mirror exactly. Also, instead of using grit, I used cerium oxide, which is a much smaller, pinkish powder that I mixed in water to make it easier to apply to the mirror. After six hours of polishing with the mirror on top, the center was nearly polished, but around the outside there was a three millimeter ring that was not polished. Twenty hours of polishing later, most of the mirror was completely polished, except for the outer ring, and the radius of curvature had shortened from 2426 millimeters to 2356 millimeters. The advice I received from the Amateur Telescope Maker network discussion archives was that I should polish with the lap on top instead of the mirror. Consequently, the outer edge polished out in two hours, and I was ready to begin figuring the mirror.
After the mirror was all polished, I took it to Chabot again to test the figure. The Ronchi test that I used showed that it was hyperbolic with the edge turned down. See Figure 5, Foucault Test, and Figure 6, Pictures of a Ronchi Test, for a diagram and explanation of how the tests work. Since the Ronchi and knife-edge tests are null tests for a sphere, it is easiest to figure a sphere first and then do the measurements to get the parabola that is closest to it. I polished the mirror using short strokes to get a sphere. Once the sphere was good enough, I used longer strokes to turn it into a parabola. I took measurements of the differences in radii of curvature with the Foucault test. From these measurements I could determine how far off from a parabola I was.
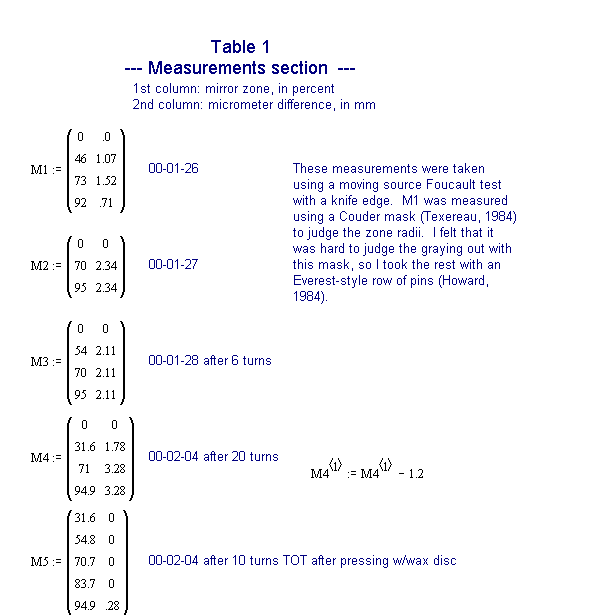
The raw data I took on the figure of the mirror can be found in Table 1, Measurements Section. I took some data before this, but I guessed on the zone percent from the center, so I figured that this data was not reliable. On the first data set I recorded I used a Couder mask (Texereau, 1984) to judge the zone radius. The mask is Figure 7, Couder Mask. This mask over the mirror made it too difficult to tell when each zone grayed out, so for the subsequent measurements I judged the zones with an Everest-style row of pins (Howard, 1984). See Figure 8, Everest Pins. The measurements are the differences in radii of curvature of the mirror in relation to the center zone. Changes in radius of curvature relate to microscopic, unmeasurable changes in the surface of the mirror. The graph of the data, Figure 9, Millies-Lacroix Mirror Plot, shows the effects of polishing the mirror more (Miller, 1979). The first trial shows that the shape was not consistent, as the radius peaked at the 73 percent zone and then fell off at the edge. The second trial shows that the "hole," or slightly more dished part, in the center had deepened so that the overall difference in radius had increased. By the third trial, the hole was shallower, and a larger percent of the outer zone was spherical together. This was a slow progression towards the ideal, which is also on the graph. Trial four is not represented clearly enough to see the true shape because I took no reading in the 50 percent zone. I could see that the hole was smaller, so for figuring purposes it was not necessary to take the middle reading. With it, though, the graph would show that a greater portion of the outside zone had the same radius of curvature. Since the hole deepened again, I cut a small circle of wax paper to put in between the mirror and lap as they pressed. It made a small indentation in the pitch so that the center would not wear as fast as the outer zones. This was in order to reduce the hole in the center of the mirror and reduce the overall difference in radii of curvature. As the graph of the last trial shows, this method of polishing made the mirror mostly spherical overall, with a desirable slight turn on the edge. The center was still dished, but it was too small a difference to measure, so it does not show up in the data. See Figure 10, Foucault Test for Final Trial, and Figure 11, Ronchi Test for Final Trial. As another indicator of the quality of the mirror after the fifth trial, I also put the measurements into a program called SixTests, which can perform six different tests on the data it is given. I used a surface integration to get a plot of the surface of the mirror in relation to the best fitting parabola. The graph shows that the surface is nearly 50 nanometers off from the parabola. See Figure 12, Surface Integration Plot.
The data for the fifth trial would appear to suggest that the mirror is not yet high enough quality to be used. On Figure 9, Millies-Lacroix Mirror Plot, the graph of the measurements is outside the tolerances. However, it is possible to shift the graph vertically because it does the same thing as refocusing it. Shifting the graph of the fifth trial upward, it fits neatly into the tolerances, showing that it is a decent mirror. Other results from the SixTests program show that the RMS deviation of the surface from a parabola is slightly better than the goal. See Table 2, SixTests Results. Over all, I reached my goal of making a mirror that is as good as machine-made ones, although there is still room for improvement. I have demonstrated that it is feasible to make high-precision surfaces by hand with crude tools.
I used the same method for making my mirror as most of the amateur telescope makers, and I have shown that this method, which has been tried and tested many times by many people, works well. I did, however, find the Everest-style pins worked better than the Couder mask for determining when sections of the mirror gray out together, even though the Couder mask is a much more widespread method. I received a lot of advice on which strokes to use to figure the mirror, and there was no general consensus on what to do. I found that using short strokes with the pitch lap on top is a good way to make the mirror spherical, and then using longer strokes brings it to a parabola quite nicely.
An interesting phenomenon I saw while using the Foucault tester was Schlieren patterns from the heat waves when someone passed their hand underneath the mirror. This effect is similar to the one that makes the shock waves visible in photographs of airplanes in wind tunnels. This would be an interesting subject to pursue in relation to the Foucault tester. There are many other subjects related to mirror-making that would be worthy of investigation, as well, such as how different reflective coatings on a mirror affect its quality.
Over all, I have made a usable telescope mirror and confirmed the effectiveness of the methods used by most amateur telescope makers. I have also shown that the Foucault tester is a good way to measure the radius of curvature of various zones on the mirror.
I would like to thank and acknowledge the help of my dad throughout the whole mirror process. He has helped me with the research and interpreting the data, as well as building the rest of the telescope for me. I would also like to thank the experienced telescope makers at Chabot Observatory, headed by Paul Zurakowski, who gave me advice on my mirror. Finally, I would like to thank Paul Barton for lending me his Foucault tester and offering advice.
Amateur Telescope Makers Archives. http://astro.umsystem.edu/atm/
Brown, Sam. All About Telescopes. Edmund Scientific Co., Barrington, 1975.
Burrows, Jim. SixTests. computer program, available at http://www.halcyon.com/burrjaw/atm/odyframe.htm
Dobson, John L. How and Why to Make a User-Friendly Sidewalk Telescope. Norman Sperling, ed. Everything in the Universe, Oakland, 1991.
Howard, Neale E. Standard Handbook for Telescope Making, revised edition. Harper & Row Publishers, New York, 1984.
Keller, Dale. Newt. computer program, available at http://home.att.net/~dale.keller/atm/newtonians/newtsoft/newtsoft.htm
Miller, Robert P. "Stalking the Wild Paraboloid," Telescope Making. Winter 1979/1980.
Texereau, Jean. How to Make a Telescope, second edition. translated by Allen Strickler, Willmann-Bell, Inc., Richmond, Virginia, 1984.
Kirsten's mirror 02-04-00 9:15pm
Moving-source Foucault
Focal length of best fit parabola = 1176.0 mm.
| Surface Wavefront | |||
| nm | (550 nm) | Goal | |
| P-V | 72.7 | 1/3.8 | <1/4 |
| RMS | 19.9 | 1/13.8 | <1/13.4 |
| Strehl ratio | 0.810 | >0.8 | |
| Geometric conic fit: | R = 2352.6 mm | deformation b = -0.14 |
The root-mean-square (rms) deviation from a parabola shows that it is as good as the goal. The Strehl ratio shows how much the light is maintained in the tightest possible pattern. A value of 1 shows that the maximum possible amount of light is reflected in the middle, and a value of 0 shows that it is all being diffracted.
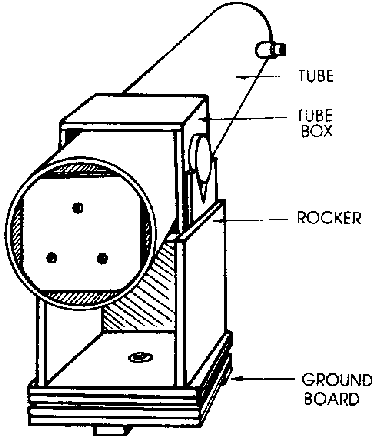
This is a typical Dobsonian telescope. The protrusion at the top right is the eyepiece. At the lower left end of the tube is the holder for the mirror. The three circles on the end are screws that tilt the mirror so that it can be aimed straight down the tube. The circular pieces on each side of the tube box are bearings on which the telescope can tilt vertically. The rocker box swivels against the ground board to allow horizontal movement. This diagram was taken from Dobson, 1991, page 63.
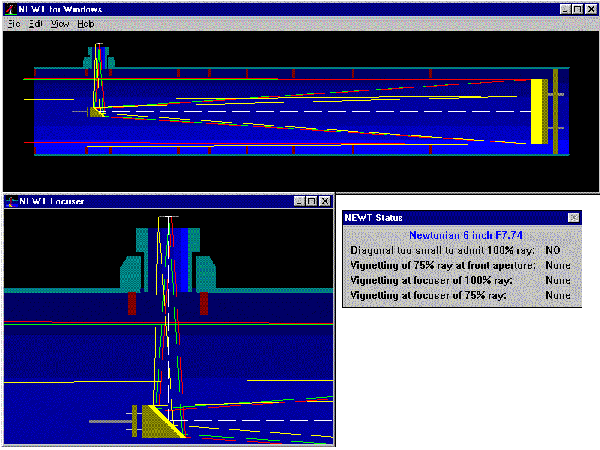
This diagram comes from a program called NEWT. The yellow rectangle at the end of the tube is the primary mirror. The small diagonal yellow rectangle is the secondary mirror. The colored lines show the light path through the telescope from the star to the primary mirror, reflected to the secondary mirror, and then through the eyepiece. The enlarged box shows details of the secondary mirror and the eyepiece.
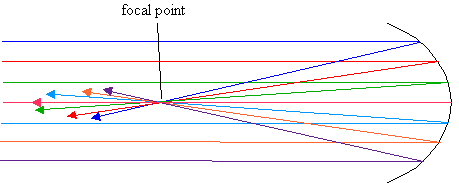
All light rays which are parallel to the axis of symmetry and reflect off the parabola pass through the focal point.
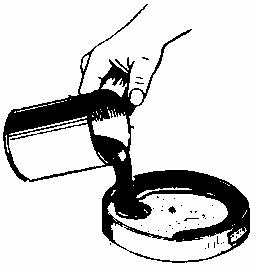
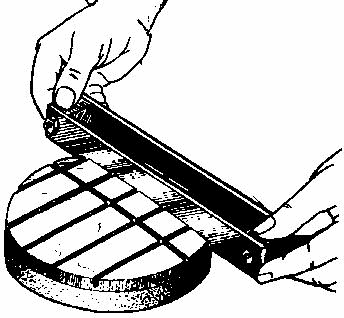
Figure a. shows pitch being poured onto the tool with tape around it to act as a dam. Once the pitch has cooled slightly, channels are pressed into it, as in b. The channels allow any bubbles in the pitch to work themselves out and give the pitch somewhere to flow to. The pitch must be able to flow over time so that it always stays the exact same shape as the mirror. These pictures are from Brown, 1975, pages 186 and 187.
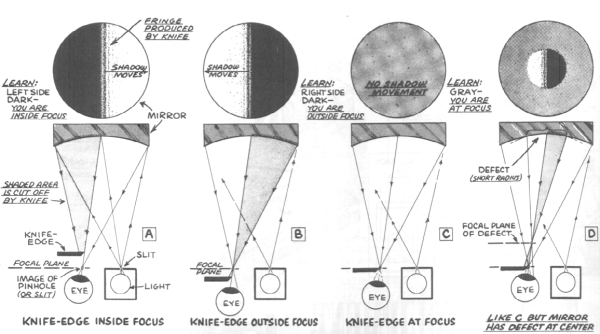
This figure was taken from Brown, 1975, page 192. When the knife edge is inside focus, it intercepts the light waves, so the mirror blacks out across the mirror in the same direction that the knife edge moves, as in A. When the knife edge is outside focus, the light waves have already crossed, as in B., so the mirror blacks out from the side opposite the knife edge. When the knife edge is at the focus, it intercepts light from the entire mirror at once, so it grays out simultaneously, as in C. D shows how different parts of the mirror can have different radii of curvature, so a combination of the effects can be seen. Measuring the differences in radii of curvature between each zone shows how the surface varies from a sphere. Measurable differences on the order of millimeters can be extrapolated to find the unmeasurably small differences on the surface of the mirror in fractions of a wavelength of light.
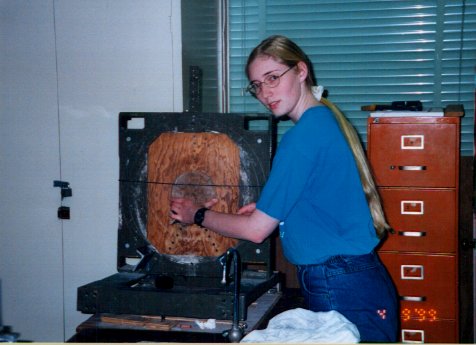
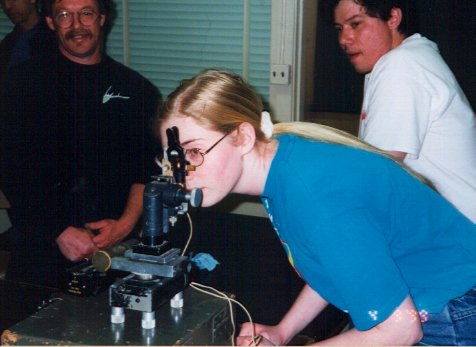
These pictures of me using the Ronchi test were taken at Chabot Observatory's telescope-making workshop. In figure 6a, I am placing the mirror on the holder. In figure 6b, I am looking through the Ronchi tester at the mirror. The tester has a beam of light shining through a grating of parallel bars, and I am looking through an identical set of parallel bars. I see several dark and light vertical bands on the mirror. When they are perfectly straight, the mirror is a sphere. If the bands are bent, I am able to determine if the mirror is dished in a certain area or not curved enough in some places.

This design for a Couder mask came from Texereau, 1984. I placed this mask over the mirror when I was doing a Foucault test so that I could judge when each of the corresponding zones grayed out together. When the zones at the same percentage from the center grayed out together as I moved the knife edge across, the knife edge was at the center of curvature for that zone.
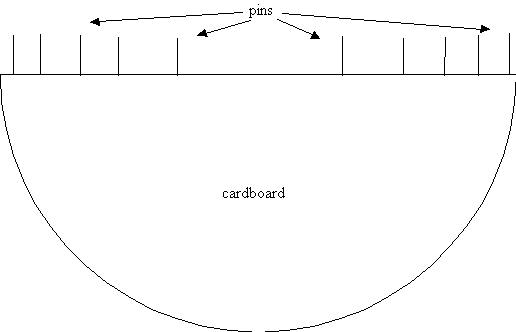
This is a diagram of the Everest pin setup that I used, which is a semicircle of cardboard with ten pins attached to the straight side. The pins mark the percent distance from the center of the mirror at 31.6%, 54.%, 70.7%, 83.7%, and 94.9% on either side. I placed this cardboard piece over the mirror when I used the Ronchi test so that I could determine how far out from the center the mirror was graying out.
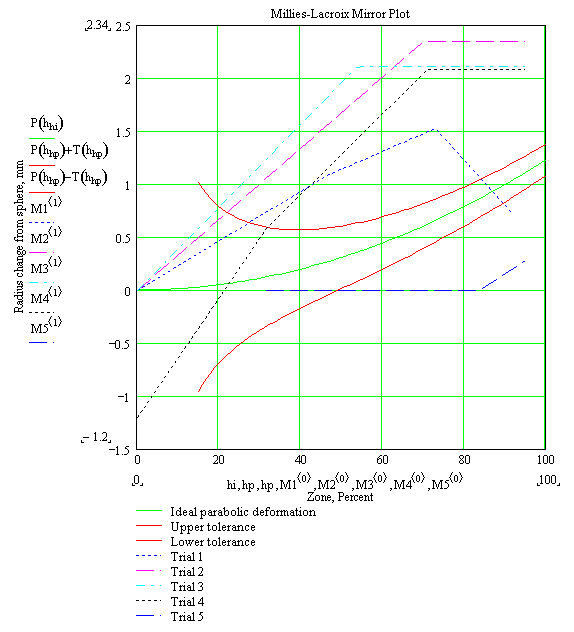
The first trial shows that the shape was not consistent, as the radius peaked at the 73 percent zone and then fell off at the edge. The second trial shows that the "hole," or slightly more dished part, in the center had deepened so that the overall difference in radius had increased. By the third trial, the hole was shallower, and a larger percent of the outer zone was spherical together. This was a slow progression towards the ideal, which is also on the graph. Trial four is not represented clearly enough to see the true shape because I took no reading in the 50 percent zone. I could see that the hole was smaller, so for figuring purposes it was not necessary to take the middle reading. With it, though, the graph would show that a greater portion of the outside zone had the same radius of curvature. Since the hole deepened again, I cut a small circle of wax paper to put in between the mirror and lap as they pressed. It made a small indentation in the pitch so that the center would not wear as fast as the outer zones. This was in order to reduce the hole in the center of the mirror and reduce the overall difference in radii of curvature. As the graph of the last trial shows, this method of polishing made the mirror mostly spherical overall, with a desirable slight turn on the edge. The center was still dished, but it was too small a difference to measure, so it does not show up in the data.
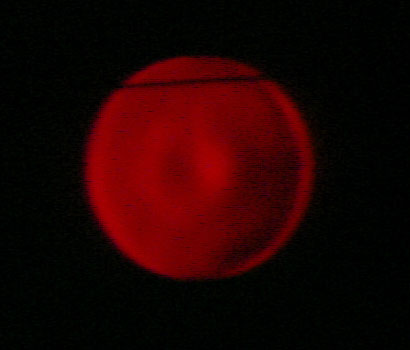
This is what I saw using the Foucault test on the mirror for the last trial. The black line across the top is a cord that holds the mirror in place. The very slight hole in the center is visible, as is the simultaneous graying of the outer region. The lighter ring around the outside is from diffraction, not the shape of the mirror.
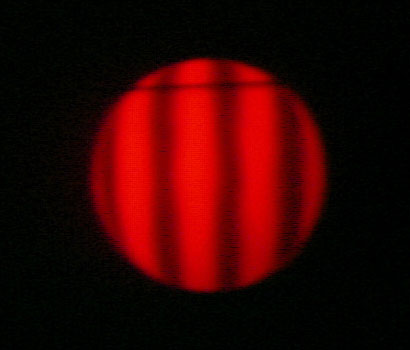
The horizontal line at the top is a cord to hold the mirror in place. This Ronchi test shows the same information that Figure 10 does. The slight curvature of the lines is an indication of the dished effect in the center.
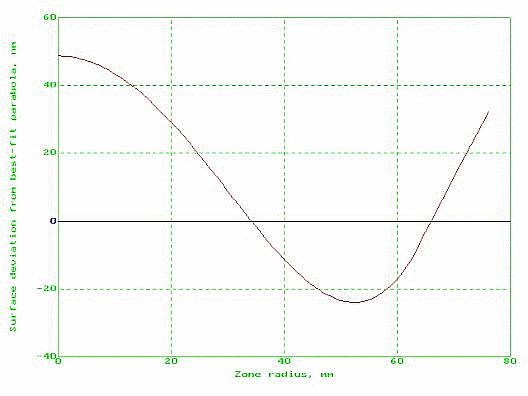
This graph was made using SixTests. The program integrated the focal lengths that I measured on the fifth trial to get a plot of the surface in relation to the best fit parabola.
 |
return home | Sign Guestbook | View Guestbook |