
Fig.1.Dialog Interface of Interactive Oil Spill Model for the Black Sea
Operationally, the hybrid model is controlled primarily from the “Oil Spill Model” Dialog Box with a map of the Caspian Sea, as shown
in Figure 8. The model is started by pressing an “Update and Run” button, which reads the bathymetry, predetermined current
velocities, and model and source parameters. A source position is selected by the pointing the mouse at the desired location.
In doing so, the latitude-longitude coordinates and instantaneous depth are displayed. The user chooses whether the spill occurs
in bulk or continuous fashion, and in the latter case specifies the period of spill. Once the model is running, the user may also
specify the wind and wave conditions as well as which fraction portion of the oil (evaporated, beached, etc.) is to be displayed
during the simulations. It should be noted that once the “Update and Run” button is clicked, the model runs a separate graphic
window displaying the motion of the droplets as time goes on. The concentration fields determined from particle density and oil
fraction distributions during the spilling process are displayed on the map and in corresponding frames at the upper right corner
of the main Dialog Box. A special "Properties" Dialog Box, which appears by clicking a “Setup Hydrocarbon Groups” button,
allows the user to input type and properties of crude oil.
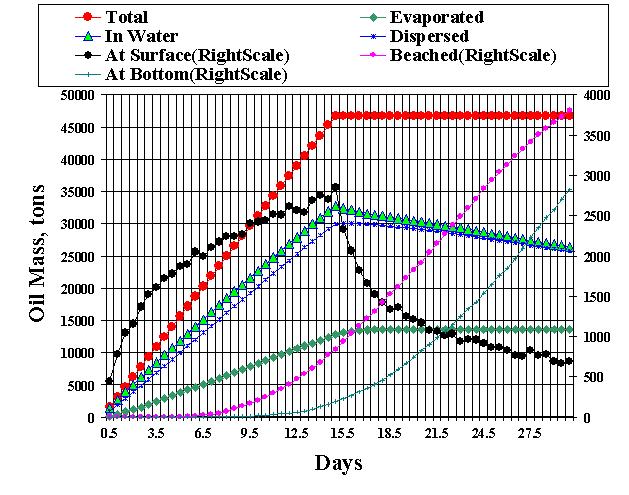
Fig.2. Computed oil fate as a time history of oil emitted, oil evaporated, oil at the sea surface, oil dispersed below the surface,
oil beached, and oil deposited at the bottom in the 15-day blowout numerical experiment.
See more deatails in:
2003
Modeling
Circulation and Oil Spill Transport and Dispersal in the Black Sea (with D. E.
Dietrich and M. J. Bowman).See Paper