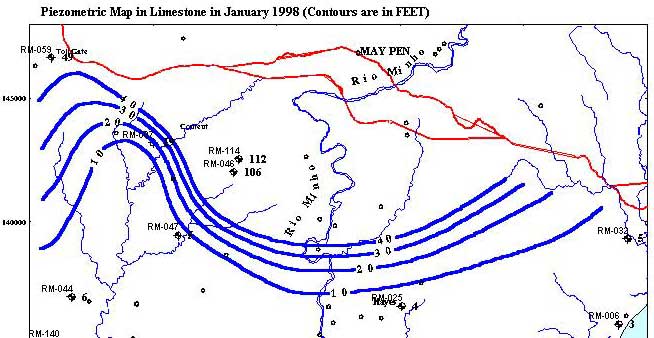
![]() he map displays contours in limestone aquifer in the lower part of the Clarendon Plain.
The flow is in general toward the sea. The entire area is depressed as a result of pumping. The contour line 20 ft (about 6 m) near the coast could be taken as an approximate southern limit of the cone of depression. Contour lines are curved around the Milk River, indicating an underflow parallel to the river bed.
he map displays contours in limestone aquifer in the lower part of the Clarendon Plain.
The flow is in general toward the sea. The entire area is depressed as a result of pumping. The contour line 20 ft (about 6 m) near the coast could be taken as an approximate southern limit of the cone of depression. Contour lines are curved around the Milk River, indicating an underflow parallel to the river bed.
![]() he map is created solely with ground water levels from wells. It may need additional input such as Rio Minho and Milk River water elevations in places where the aquifer discharges into the rivers.
he map is created solely with ground water levels from wells. It may need additional input such as Rio Minho and Milk River water elevations in places where the aquifer discharges into the rivers.