ABSTRACTIONS IN RIO MINHO BASIN
 art One: Situation
in 1970s and 1980s
art One: Situation
in 1970s and 1980s
Water Resources Development Master Plan, Jamaica that was prepared in 1985 by Ministry of Agriculture under a UNDP project discussed the production from aquifers within the Rio Minho Basin in the following way.
Clarendon Plains Limestone Aquifer
Production capacity of 480 MCM/yr (from 141 wells) supported average annual production of 215 MCM (in the period between 1970 and 1976), mainly from that section of the limestone aquifer beneath the Clarendon Plains. Maximum monthly production of 31.9 MCM was recorded in May 1975. Well yields average 3.4 MCM/yr (9,315 m3/day or about 108 l/s).
Discharge from the Cockpit Springs support average annual production of 20 to 34 MCM. In the last several years, the discharge from the Cockpit Spring was as shown in the linked graph.
Mean annual diversion from the ground water sustained Milk River was estimated at 15 MCM.
Total production from the aquifer of 257 MCM/yr represented 92% utilisation of its safe yield.
Clarendon Plains Alluvium Aquifer
Installed well production capacity total 102 MCM/yr (65 wells) with reported average annual abstraction of 61 MCM (1970-76). Maximum monthly production of 7.9 MCM was reported in december 1976. Well yields average 1.0 MCM/yr (2,740 m3/day or 32 l/s).
Alluvium discharge into the perennial reach of the Rio Minho downstream of Alley supports abstraction of about 21 MCM/yr.
The potential of the alluvium aquifer is being over utilised with implication for a forced medium or long term reduction in well production if progressive salinisatiojn of the aquifer continues.
Manchester Highlands Limestone Aquifer
In 1970s, there was only one well developed within the basin, i.e. the Victoria Town well. (In later years, the wells were drilled in Mile Gully area, around Mandeville, New Forest, and in other places.) The Victoria Town well had an average annual production of 0.1 MCM (274 m3/day or about 3 l/s).
Ground water discharge sustains a 5 sq.km coastal swamp (10 km by 0.5 km) which was developed as a national park and nature laboratory. Any significant utilisation of aquifer safe yield could be expected to reduce the inflow of fresh ground water into the swamp, resulting in a reduction of the size of the swamp and a shift to more saline environments within the swamp.
art Two: Abstraction
Data Currently In GWIS Established For Rio Minho Basin
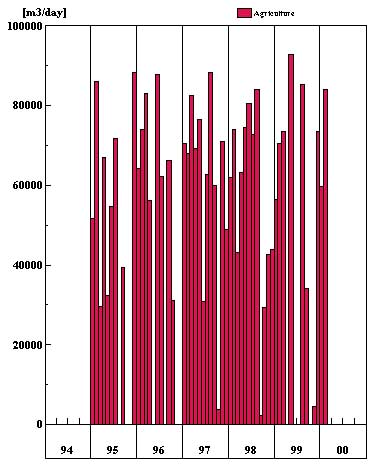
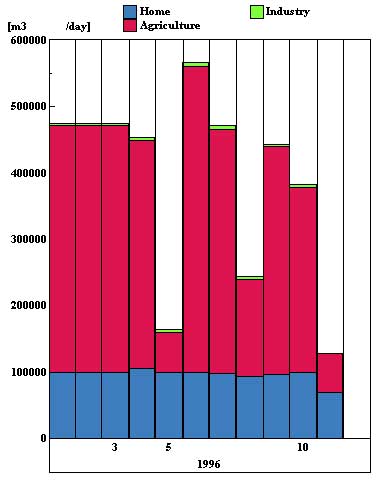
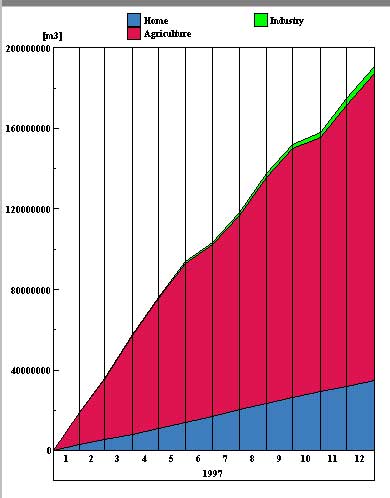
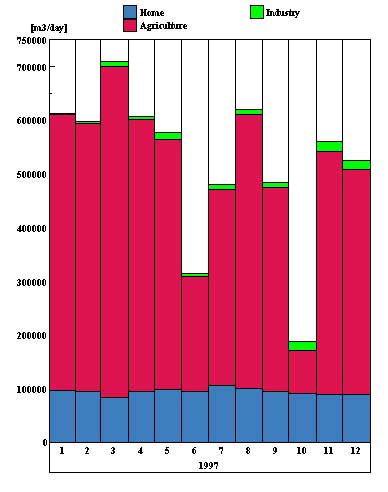
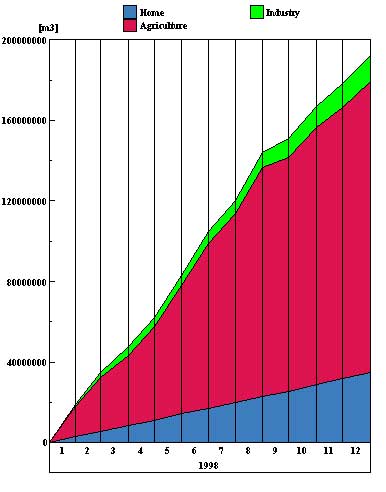
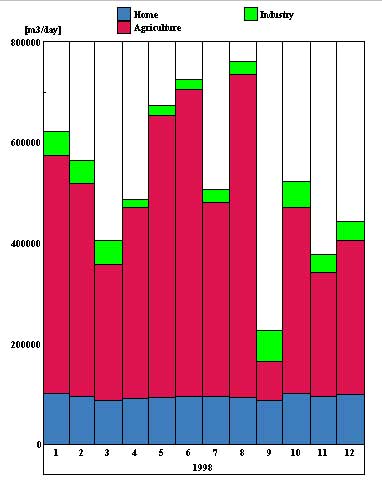
Not all data are transferred into the abstraction portion of the GWIS data base. The total annual production in the period 1995 through 1999 which is supported by the data base is hardly greater than 190 MCM (in 1998), and much less in 1999 (143 MCM), and in earlier years. Evidently, not all data were reported.
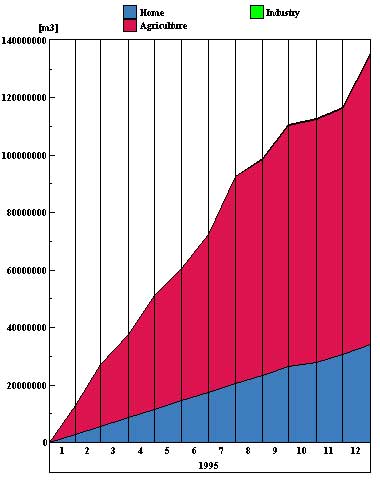
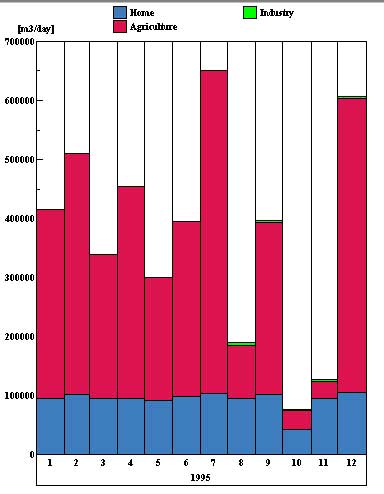
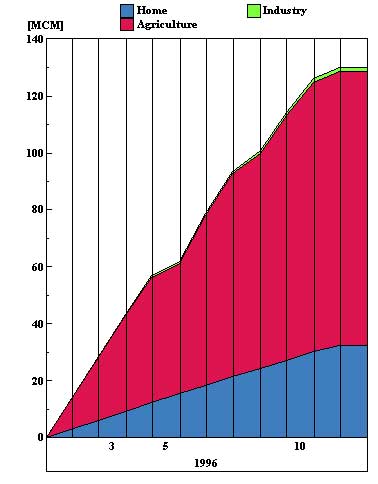
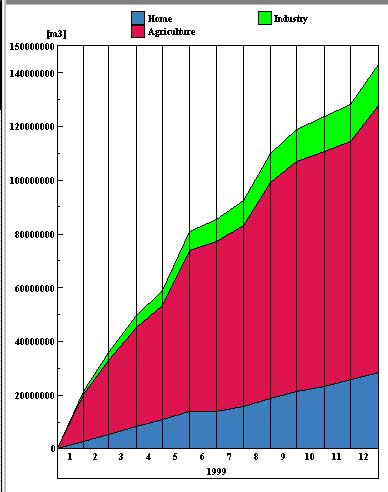
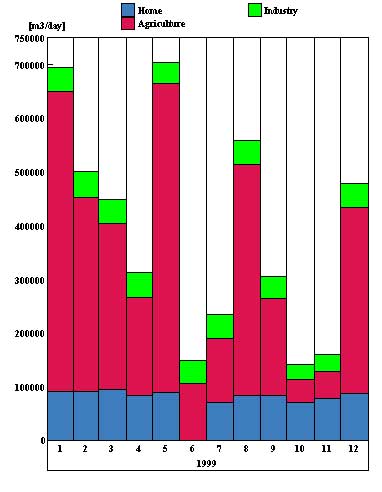
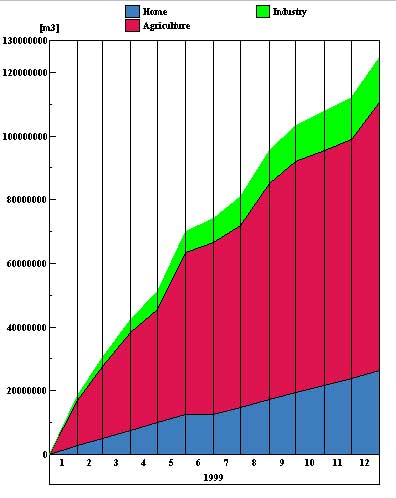
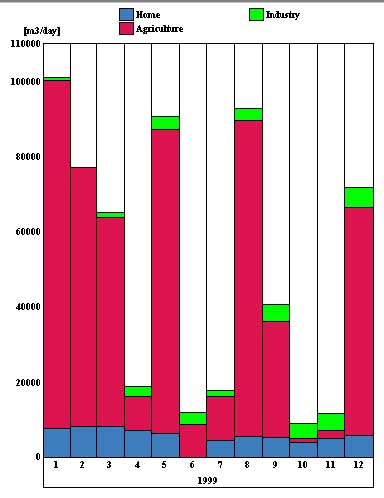
The cumulative diagrams with all abstractions that was entered into the GWIS are shown in two ways: (1) as cumulative and progressive with time starting at zero in January 1995, and (2) as individual daily rates for each month of the period January 1995 through December 1999.
The graphs can be displayed by selecting the proper link in the following table.
art Three: Abstractions in
1999
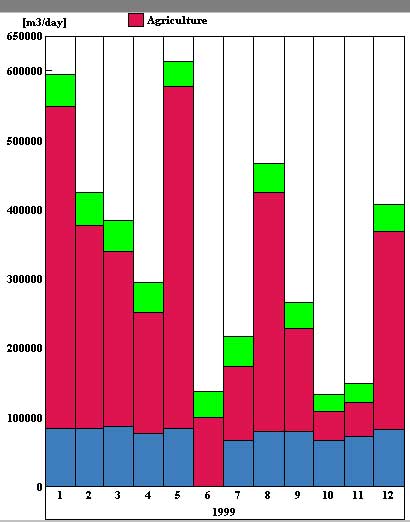
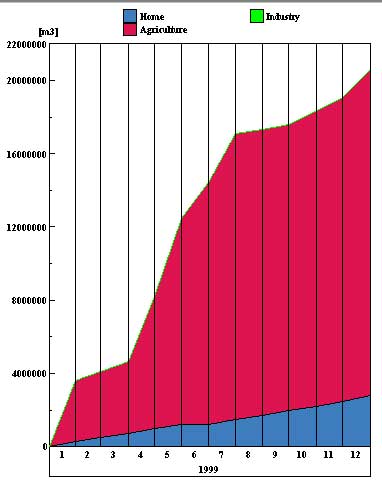
One may display the total abstraction from limestone aquifer (both Manchester Highlands and underlying Clarendon Plain),
expressed in daily rates (m3/day);
expressed as cumulative volumes (in m3).
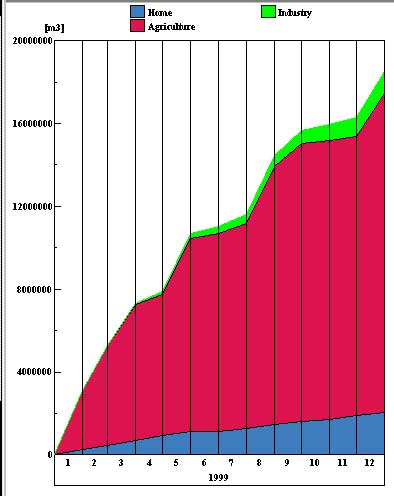
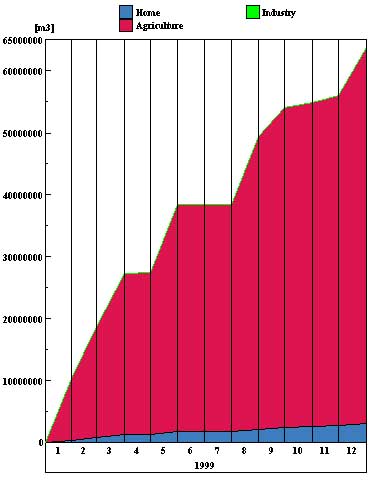
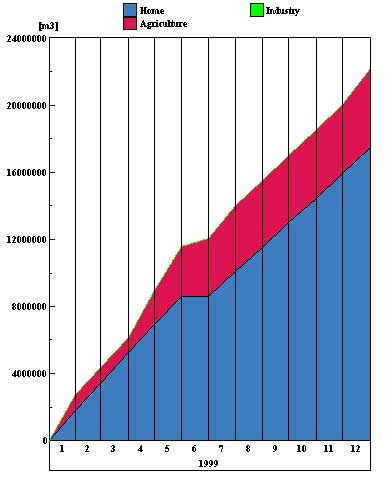
The total abstraction from alluvial aquifer (Clarendon Plain) can be displayed
as daily rates (in m3/day);
as cumulative volumes (in m3).
Abstraction in 1999 for Major Water Users
Major users are Sugar Company of Jamaica, National Irrigation Commission, and National Water Commission.
The following table displays currently entered abstraction volumes by major users and according to uses in 1999. The values are volumes in million cubic metres (per year).
| Use | S.C.O.J. | N.I.C. | N.W.C. | TOTAL all users/uses |
| Domestic | 3.2 | 2.8 | 17.5 | 28 |
| Agriculture | 60.5 | 17.8 | 4.7 | 99 |
| Industry | 0 | 0 | 0 | 15 |
| TOTAL | 63.7 | 20.6 | 22.2 | 143 |