We always have hurricanes, tornados, floods, and extreme weather conditions. But in recent years we have been unlucky and Mother Nature has not been kind to us humans. Having a category 1 or 2 hurricane is normal. Hurricane Katrina was not; it was more than just a hurricane, it was a sign. This may be a warning for us, because of global warming.
History of Hurricane Katrina:
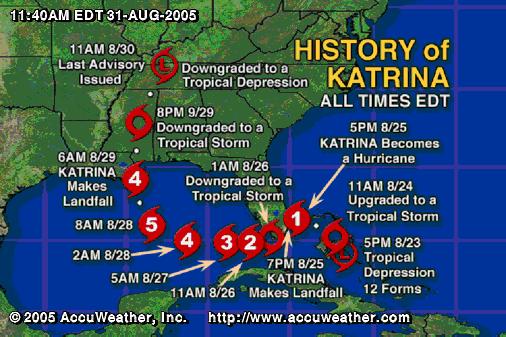
Hurricane Katrina born is in the Atlantic Ocean southeast of the Bahamas. Here is a timeline.
August 23, 2005: It started as a tropical depression (Comic Relief, 2007).
24 hours later, it started to gain strength and became a tropical storm and started to move North West of the Bahamas (Comic Relief, 2007).
August 25, 2005 Hurricane Katrina became category one winds speed around 75 and higher, (Comic Relief, 2007).
The first landfall in Florida and becomes a tropical storm. (Comic Relief, 2007) Since there is an upper level anticyclone over the Gulf of Mexico, Hurricane Katrina made a major development because of the warm water winds, at Florida Hurricane Katrina decreases it intensification.
August 26, 2005 hurricane Katrina re-strengthens it self and moved westward due to the ridges on the water by Texas (National Climate Data Center, 2007)
August 28, 2005 in the next forty eight hours later hurricane Katrina became category 5 reaching its maximum speed of 170 mph.
8 am hurricane Katrina makes the landfall in New Orleans then travels north and slightly towards east. (Boston, 2007)
August 30, 2005; hurricane Katrina ends its great journey from being a tropical storm to a tropical depression.
Here is an image with Hurricane Katrina Timing, which shows how hurricane Katrina affected everyone with its journey.
Source(Boston,2007)
Human Cost:
Hurricane Katrina had a major impact on the Gulf Coast. Human costs wise, infrastructure costs, environmental costs and economic costs as well. The way it impacts in human cost, was in the injuries, illness, and deaths that happened. The total numbers of deaths that have been reported were one thousand in New Orleans, two hundred in Mississippi, and seven additional in Florida. In addition still as May 3, 2006 four hundred and forty-nine people are missing (Gary. R & Lockwood, 2006).
According to the CDC, all through September 5-11, 2005, strong observation data from eleven thousand four hundred and twenty four patient visits were reported on a daily basis from up to fifteen facilities, which make an average of one thousand six hundred and thirty two visits per day. One thousand one hundred and ninety six were children aged five and under reported on a daily basis by seven to thirteen facilities.
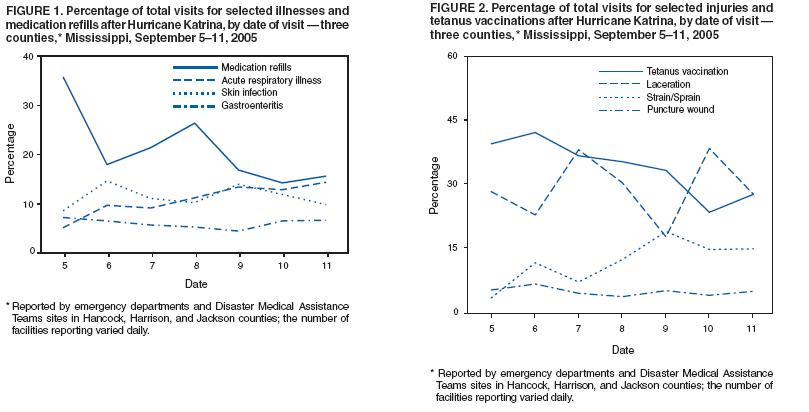
The most common type of illness reported was skin and wound infection. The upper respiratory infections had patients of one thousand two hundred and twelve; rashes and insect stings and bites, and seven hundred and sixty one lower respiratory infections. Along with gastrointestinal conditions, nausea and vomiting was the most common syndrome seven hundred forty three, followed by watery diarrhea two hundred and eighty eight, and bloody diarrhea sixteen. A total of six hundred and seventy five visits were for mental health concerns; forty three suicide attempts were reported. Totaling, thirteen thousand six hundred and fifty five were categorized as other infirmity. Although visits for particular condition varied daily, no trends or outbreaks were distinguished. The graphs shown below, are showing the affect of patients who were treated for medicine and were given vaccination for illness and medical treatment after Hurricane Katrina:
Source: (CDC, 2006)
These two graphs are actual data record after hurricane Katrina hit New Orleans. The graph on the left side is a percentage for specific illnesses, medications refills. It includes three counties. The graph on the right is also in percentage and its shows injuries, tetanus vaccination, in three counties (CDC , 2006)
INFRASTRUCTURE COST:
According to the refuge of last resort, the total number of housing units damaged, destroyed, or unattainable due to Hurricane Katrina was one hundred million. Almost everyone who has lost or has been displaced due the circumstances that hurricane Katrina has brought upon them; they have been placed in nineteen different states.
Here is one of the most key facts that should be known to everyone who lives in this very world. This fact sheet is as of 2006 (Comic Relief , 2007):
1. Number of churches, synagogues, and mosques damaged or destroyed: approximately 900
2. Homes in New Orleans still lacking electricity: approximately 50%
3. New Orleans schools damaged by Katrina: 83%
4. Bus routes now operational: 49%
5. Buses back in service: 17%
6. Amount given to Louisiana by U.S. Dept. of Education for charter schools since Katrina: $44.8 million
7. child-care facilities yet to reopen: 79%
8. 8-mi Twin Span bridge connecting New Orleans with Slidell, LA that collapsed into Lake Pontchartrain: 40%
9. Number of destroyed miles on U.S. Highway 90 running along Gulf Coast between New Orleans and Pascagoula, MS: 100
10. Amount of federal funding requested by the Army Corps of Engineers for Louisiana hurricane/flood protection programs in 2004: $105 million
11. Amount of money they actually received: $40 million
12. Amount of money sent by Homeland Security to states to combat natural disasters: $180 million
According to officials nearly one million people were temporarily without electricity in Louisiana for several weeks. On September 1, 2005, eight hundred thousand homes were without electricity. Numerous roadways were flooded or damaged and countless evacuations conducted by boat along with helicopter (Comic Relief, 2007)
Work Cited
Annette Wells (2005, December 11). �Battling stress of new life; Katrina victims work to rebuild, begin anew�. The Sun. Retrieved April 7, 2008, from ProQuest Newsstand database.
Calvin Mackle (2007, September 1) �Katrina: Two tough years later�. Afro - American Red Star. Retrieved April 7, 2008, from ProQuest Newsstand database.
CDC. (2006, may 9). U.S. Department of Health and Human Services. Retrieved may 7, 2007, from CDC : http://www.cdc.gov/mmwr/preview/mmwrhtml/mm5509a2.htm#fig1
Gary Tufel (2008, February). �New Orleans: Still Rebuilding�. Tradeshow Week. Retrieved April 5, 2008, from ABI/INFORM Trade & Industry database.
Janus Adams (2007, September 30). �Two years after the storm, Katrina still challenges our assumptions�. Retrieved April 6, 2008 from Southern Connecticut Newspaper
Jennifer Howard (2008, February). �History Written in the Blink of an Eye�. The Chronicle of Higher Education. Retrieved April 6, 2008, from Wilson Education Abstracts database
National Climate Data Center. (2007, June 20). NOAA/National Climatic Data Center. Retrieved May 7, 2007, from National Climatic Data Center: http://www.ncdc.noaa.gov/oa/climate/research/2005/katrina.html
Lolis Eric Elie (2006, May 8). �Storm still taking toll on children�. Times - Picayune. Retrieved April 7, 2008, from ProQuest Newsstand database.
Comic Relief . (2007, N/A n/a). Refuge of Last Resort . Retrieved may 5, 2007, from Refuge of Last Resort : http://www.refugeoflastresort.net/Katrina_Fact_Sheet_new.pdf
Gary, R., & Lockwood, C. (2006, n/a n/a). �Hurricane Katrina Aftermath� Retrieved April 9th, 2008 from ProQuest Newsstand Database.