Got
Milk?
Have you ever wondered whether the makeup of milk
was the same for different species? If not, what animals would you
consider to produce similar milks? In this analysis we looked at the
percent water, protein, fat and lactose found in different types of milk.
The animals under consideration were Horses, Donkeys, Mules, Camels, Llamas,
Zebras, Sheep, Buffalo, Foxes, Guinnea Pigs, Pigs, Rabbits, Rats, Deer, Reindeer
and Whales. We used various methods of Cluster Analysis to see which of
these animals had similar milk types. After examining hierarchical
tree diagrams, ROC curves, Hotellings T - squared statistic, RSQ and SPRSQ we
found that the Average Linkage Method, producing 3 clusters was the best
analysis.  This analysis put the following animals into
clusters:
This analysis put the following animals into
clusters:
Cluster 1: Horse, Donkey, Mule, Llama, Camel, and
Zebra
Cluster 2: Sheep, Buffalo, Fox, Guinnea Pig, Pig, Rabbit and
Rat
Cluster 3: Deer, Reindeer and Whale
According to our analysis
these groups of animals have milk with similar makeups. After perfoming
Cluster Analysis with the Average Linkage Method, we then compared our results
using the Kmeans Clustering Method. Both methods resulted with 3 clusters
and the same animals in each cluster.
Heirarchical
Tree Diagrams
Single
Linkage Method

When looking for jumps in the hierarchical tree
diagram we would conclude that 4 or 5 clusters may be appropriate. Using the pseudo Hotelling�s
T2 statistic we find that 9, 5 or 2 clusters would be
appropriate. Looking at the RSQ
values, the appropriate number or clusters might be 8, 5, or 2. The SPRSQ values
would recommend 8, 5, or 2 as appropriate clusters.
We think that 5 clusters should
be formed using the single linkage agglomerative method. Five clusters is a candidate in each of
the methods used to determine the appropriate number of
clusters.
Average Linkage Method
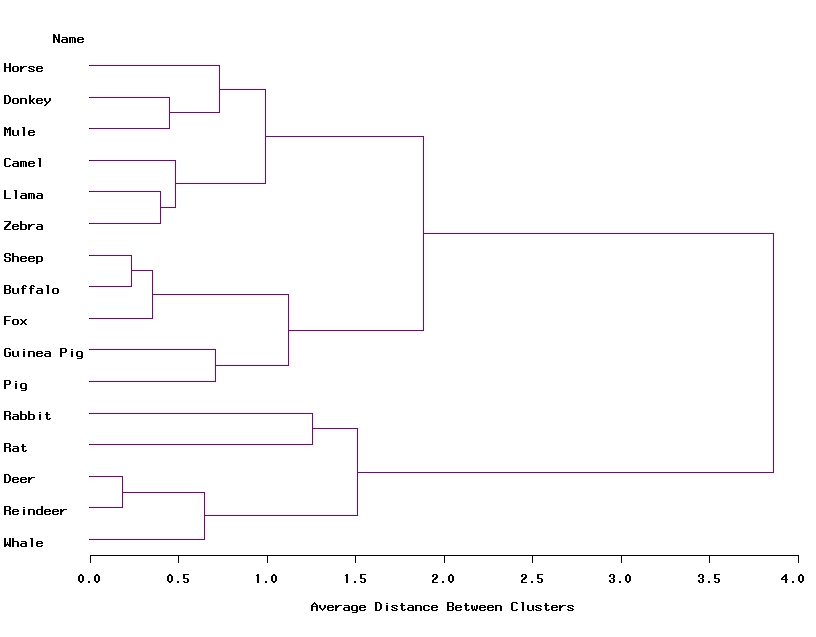
When looking for jumps in the hierarchical tree diagram we would
conclude that 7, (4 or 3) or 2 clusters may be appropriate. Using the pseudo Hotelling�s
T2 statistic we find that 10, 3 or 2 clusters would be
appropriate. Looking at the RSQ
values, the appropriate number or clusters might be 7, 4, or 2. The SPRSQ values would recommend 10, 7,
3, or 2 as appropriate clusters.
We think that 3 clusters should be formed using the single linkage
agglomerative method. Three
clusters is a candidate in many of the methods used to determine the appropriate
number of clusters. This seems
reasonable for such a small data set and seven clusters seems a bit
excessive.
Parallel
Coordinate Plots of Clusters
This plot shows that the observations in each cluster follow the
same trends across the four variables.
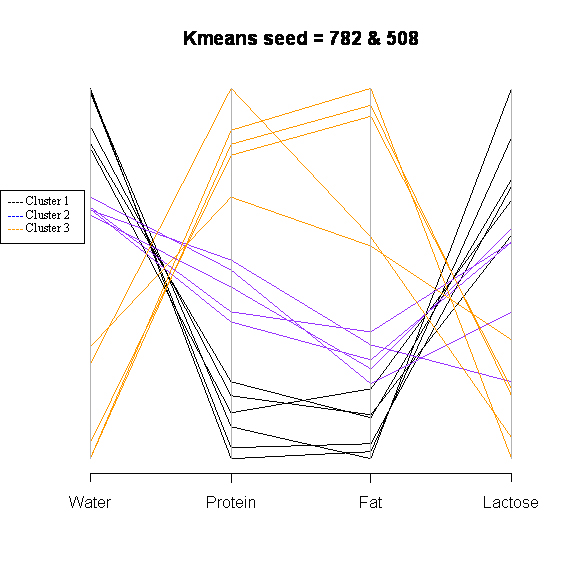
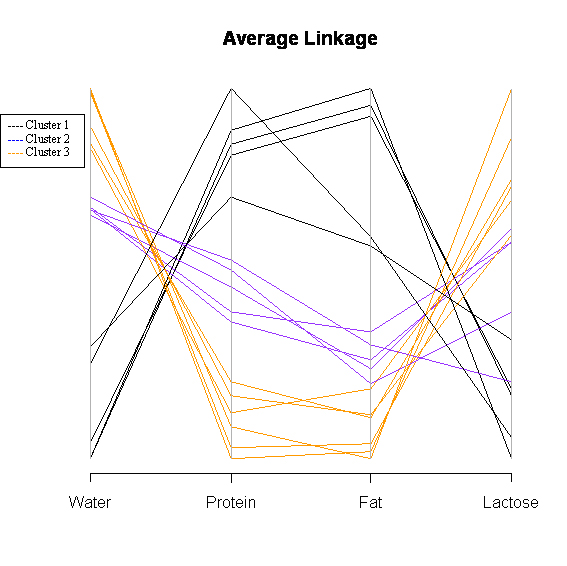
This
plot shows that the observations in each cluster follow the same trends across
the four variables.
The original data set can be found at
http://www.csit.fsu.edu/~burkardt/datasets/hartigan/file02.txt
::: Made with CoffeeCup : Web Design Software & Website Hosting
:::