By Berisso Kebede, Department of Molecular Genetics, Institute for Agronomy and Plant Breeding, University of Goettingen, Germany
Introduction
DNA sequencing methods developed around the 70's by Sanger and Gibert et al. and DNA based markers (PCR or non PCR based) developed since the 80's helped to advance the study in molecular genetics. Therefore, applications of molecular markers have reached to the level of human gene sequencing in the Human Genome Project. Moreover, applications of molecular markers in medical, biological, and agricultural science is increasing helping us to know more about the genes and thier activities. This resulted into a new advanced level of research and development that will contribute a higher benefit to human beings and others. Using molecular markers such as RAPD, AFLP, SNP and SSR, QTL mapping is widely applied in agricultural science.
A PCR based marker such as AFLP ( Amplified Fragment Length Plymorphism) is well used in plant and animal science to study genetic divesity and QTL mapping. AFLP assay is an efficient method for the identification of molecular markers which are useful in the improvement of numerous crop species. For AFLP finger prints selective primers are used. The selective amplification is based on the recognition of unique nucleotides flanking the restriction site. The principle of selective amplification can be used to adjust the number of fragments that are amplified in a PCR reaction. Optimal amplification of genomic DNA fragments is obtained by using a combination of endonuclease enzymes such as a rare cutter and a frequent cutter for the template preparation, followed by detection of the amplified fragments on denaturing polyacrylamide gels. The technique offers great flexibility in the number of loci that can be co-amplified in one PCR.
QTL mapping in highly related species could be done using AFLP marker due to the reason that AFLP marker can produce higher number of polymorphisms per reaction and it is cost effective. High poymorphism can help to develop a genetic map with better staurated markers that can represent reasonable percentage of genome of the species under study. It is common to find more than 6 to 10 polymorphism from an AFLP primer combination compared to RAPD or SSR. AFLP can also be used for marker assisted selection (MAS) in crop improvment programs. MAS can be used to analyse the genetic variations among plants and identify the gene of interest from the gene pool . For example, introgression of gene of interest from wild species such as disease resistance to the elite cultivar could be applied in practical breeding program if the marker is closely linked to the gene of interest, while in conventional breeding program, selection and multiple field trails could take much longer time which can lead to a higher costs.
AFLP is a dominant marker, moreover, the finger prints can be repeatable in multiple laboratories. The first report of AFLP procedure was from Vos et al. 1995. However, their protocol did not worked properly when we used them in our laboratory. AFLP lab procedures are longer (restriction, legation, preamplification, and amplification) compared to RAPD, SSR, ISSR.The objective of the current study was to develop an optimal AFLP procedures which can be applicable in multiple laboratories.
Materials and Methods
Fresh leaves material of 100 mg were taken from 15 to 21 day old plants and put in 1.5 ml reaction tubes (Eppiendorf) and then immersed in liquid nitrogen (-191oC) and stored at -20oC in a refrigerator. DNA was extracted using Nucleon PhytoPure plant extraction kit from Amersham ( AmershamTM Biosciences, Freiburg, Germany, 1999) according to the the manufacturers instructions with the following modification:after DNA extraction probes were put in the water bath ( 65oC) for 1 hour and then put in the refrigerator (4oC) for 2 hours and centrifuge the probes at 1300rpm for 1 minute and stored in the refrigerator (4oC) for better re suspension.
Gel electrophoresis: Detection of AFLP fragments was carried out on an automated DNA sequencer (LI-COR 4200 IR2, LI-COR Inc. Nebraska, USA). To 20 �l of the amplification product 10 �l of loading dye (98% (v/v) formamide, 10 mM EDTA, 0.025% (w/v) bromophenol blue and 0.025% (w/v)xylene cyanol was added. The DNA was then denaturated at 94oC for 4 min. The AFLP fragments were resolved using 25 cm gel apparatus with 0.2 mm spacer on 6% polyacrylamide gels which contained 7.8 M urea ( NF-urea Rotiphore�), 1 x long run TBE buffer ( 1.34 mM Tris-HCl, 450 mM boric acid, 25 mM EDTA, pH 9.2), 12% Long ranger TM (50% gel solution), 0.7% ammoniumpersulfae (10% w/v), and 0.01% TEMED. Before loading the samples, a 15 min prerun was carried out with the following settings: Voltage 1000 V, Temperature 45oC, Current 37 mA, Power 40 W. A 64 shark teeth comb was used to make slots and 1 �l of each DNA sample was loaded. Fragment mobility was measured by real-time laser fluorescence at 800 nm and was converted to a TIFF-image of the gel. Image data were collected for 5 h with the same voltage, temperature, current and power settings as in the prerun.
Different concentrations of MgCl2, dNTPs, Tag polymerase, and PCR cycling conditions were used to produce PCR probes. The PCR products were run on an automated DNA sequencer (LI-COR 4200 IR2, LI-COR Inc. Nebraska, USA) to visualise the DNA fragments. Each gel run contained a sample of 5 different cultivars of rapeseed and different primer combinations. The differences between the PCR product gel images due to differences in the concentrations of each of the above components were recorded and compared with the DNA fragments of the gel image obtained . The best combinations of the components were repeated 10 times until the standard scorable gel images were produced. The results were confirmed after production of a total of 400 gel images on an automated DNA sequencer.
Results
Optimum AFLP protocol for plants
1. Restriction
Restriction mix
Stock Concentration
Unit
Final Concentration
Unit
Volume/tube(�l)
DNA
50
ng
250
ng
5�l
Rest.Lig. Buffer
10x
U
1x
U
3�l
Eco RI
50
U/�l
4
U/�l
0.08�l
Mse I
50
U/�l
4
U/�l
0.08�l
H2O
-
-
-
-
21.84�l
Total
-
-
-
-
30�l
2. Ligation
Ligation mix
Stock Concentration
Unit
Final Concentration
Unit
Volume/tube(�l)
Rest.Lig.Buffer
10x
U
1x
U
1�l
Eco RI Adaptor
5
pmol/�l
0.5
pmol/�l
1�l
MseI Adaptor
25
pmol/�l
5
pmol/�l
2�l
T4-DNA-Ligase
3
U/�l
1
U/�l
0.33�l
ATP
100
mM
0.25
mM
0.10�l
H2O
-
-
-
-
5.57�l
Total
-
-
-
-
10�l
3. Preamplification
Preamplification mix
Stock Concentration
Unit
Final Concentration
Unit
Volume/tube(�l)
RL dilute.
250
ng
49.6
ng
8�l
PCR buffer
10x
U
1x
U
2�l
MgCl2
25
mM
4
mM
2�l
EcoRI +1
10
pmol
10
pmol
1�l
MSe I +1
10
pmol
8.7
pmol
0.87�l
dNTP's
2
mM
0.3
mM
3�l
Taq-DNA-Ploymarase
5
U/�l 9
1.5
U/�l
0.3�l
H2O
-
-
-
-
20�l
Total
-
-
-
-
20�l
4. Amplification
Amplification Mix
Stock Concentration
Unit
Final Concentration(PCR)
Unit
Volume/tube(�)
Pre-Amp dilute
1:10
Ratio
5
ng
6�l
MgCl2
25
mM
4
mM
2�l
EcoRI-Primer+3
10
pmol
2
pmol
0.2�
MseI-Primer
10
pmol
7
pmol
0.7�l
dNTP's
2
mM
0.24
mM
2.4�l
PCR-buffer
10x
U
1x
U
2�l
Taq-DNA-Polymarase
5
U/�l
0.6
U/�l
0.12�l
H2O
-
-
-
-
6.58�l
Total
-
-
-
-
20�l
Discussion
The following components are some of the factors that can affect AFLP reaction and result in poor qulity of the finger print:
1. Tag polymerase
2. The concentration of MgCl2 and dNTPs
3. PCR condition such as annealing temprature
Some primer pairs needed high concentration of MgCl2 to produce strong bands and others donot, MgCls is an important component in the reaction of the PCR products as a co-factor for Tad DNA polymerase, Too little or too much MgCl2 could reduce amplification efficiency or result in non-specific products (mis-priming). If the samples contain EDTA or other chelators, raise the MgCl2 concentration proportionately. therefore optimization of MgCl2 concentration for specific primer pairs was very important. MgCl2 affected the reaction of amplification quite strongly. For some primer pairs it was very difficult to verify even the existence of the band.The concentration of dNTPs in the reaction mix must be well balanced. If the concentration of any one of the dNTP is significantly different from the rest, the polymerase enzyme will tend to misincorporate them, slow down, and terminate prematurely.
Tag Polymarase carries out the amplification reaction by extending the primers from their binding-sites on the target along the template. It is also another factors that affected the quality of the PCR product due to the reason that the purchsed Tag polymerase differ in the standard PCR buffer recipe. Optimization of the PCR buffer has given the best AFLP product.
The PCR cycle is composed of 3 major steps:
Denature (94�C). The PCR reaction requires a single-stranded template. The first step denatures, or melts, the double-stranded template DNA so that all the DNA is single-stranded.
Anneal ( it depends on primer pairs 45-65�C). Once the template DNA has been denatured, the temperature is lowered to a level that allows the two oligonucleotide primers to anneal to the target segment of the template DNA.
Extension (72�C). The temperature is raised again to allow the Taq polymerase enzyme to add nucleotides to the 3'-end of the primer annealed to the template DNA.
For AFLP amplification, I have optimized the PCR program: initial denaturation at 94oC for 30 sec., one cycle of denaturation at 94oC for 30 sec., annealing at 65oC for 30 sec. and extension at 72oC for 1 min., and then 11 cycle of a touch down protocol with similar temperature and profile of the previous cycle. Then the annealing temperature was lowered by about - 0.7oC in each cycle to give optimum condition for all primer pairs. Then it was followed by a further 24 cycles at 94oC for 30 sec., 56oC for 30 sec. and 72oC for 60 sec. of denaturation, annealing and extension, respectively.
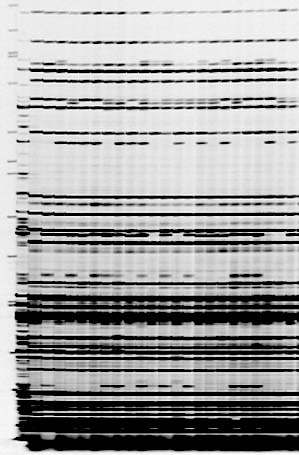
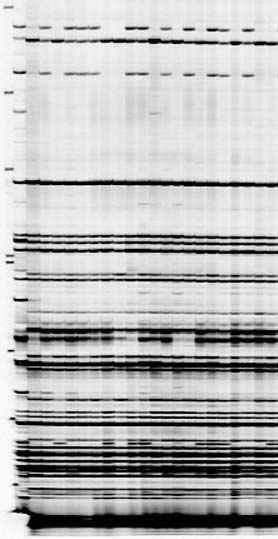
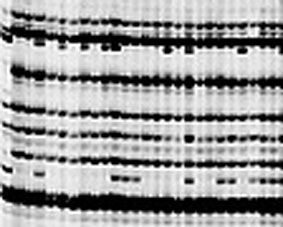
More pictures I produced using a modified protocol I developed
AFLP finger prints I produced using the modified protocol I developed above
AFLP finger prints I produced using the modified protocol given above
AFLP marker showing, polymorphic primer combination on Licor