Abstract
A mineral magnetic study of varved lake sediments from Ely Lake
in Susquehanna County, Pennsylvania was conducted in order to
correlate magnetic properties of the sediments to paleorainfall
records. A freeze core was collected from the lake bottom as
well as soil samples from the surrounding watershed. Magnetic
susceptibility (x), partial anhysteretic remanent magnetizations
(pARMs), anhysteretic remanent magnetizations (ARMs), and saturation
isothermal remanent magnetizations (SIRMs) of the lake sediments
were measured along with ARMs, and SIRMs of several soil samples.
Thermal demagnetization was conducted on selected samples in
order to determine their magnetic mineralogy. S ratios were calculated
for all samples. The age of the lake sediment was determined
by counting the annual varves downcore. Increased variability
in all magnetic parameters is seen in the last 140 years, corresponding
to the approximate time of human settlement within the watershed
of the lake. Results indicate a positive correlation between
the intensity of SIRM in the lake sediments and the local rainfall
record for the last 65 years. This suggests SIRM intensity in
the young lake sediment records rainfall intensity. Thermal demagnetization
results indicate the possibility of magnetic minerals being produced
biogenically within the water column or in the sediment column.
Such production may swamp the SIRM signal in pre-settlement horizon
and prevent correlation with SIRM intensity. Further study is
needed to better constrain this model.
Introduction
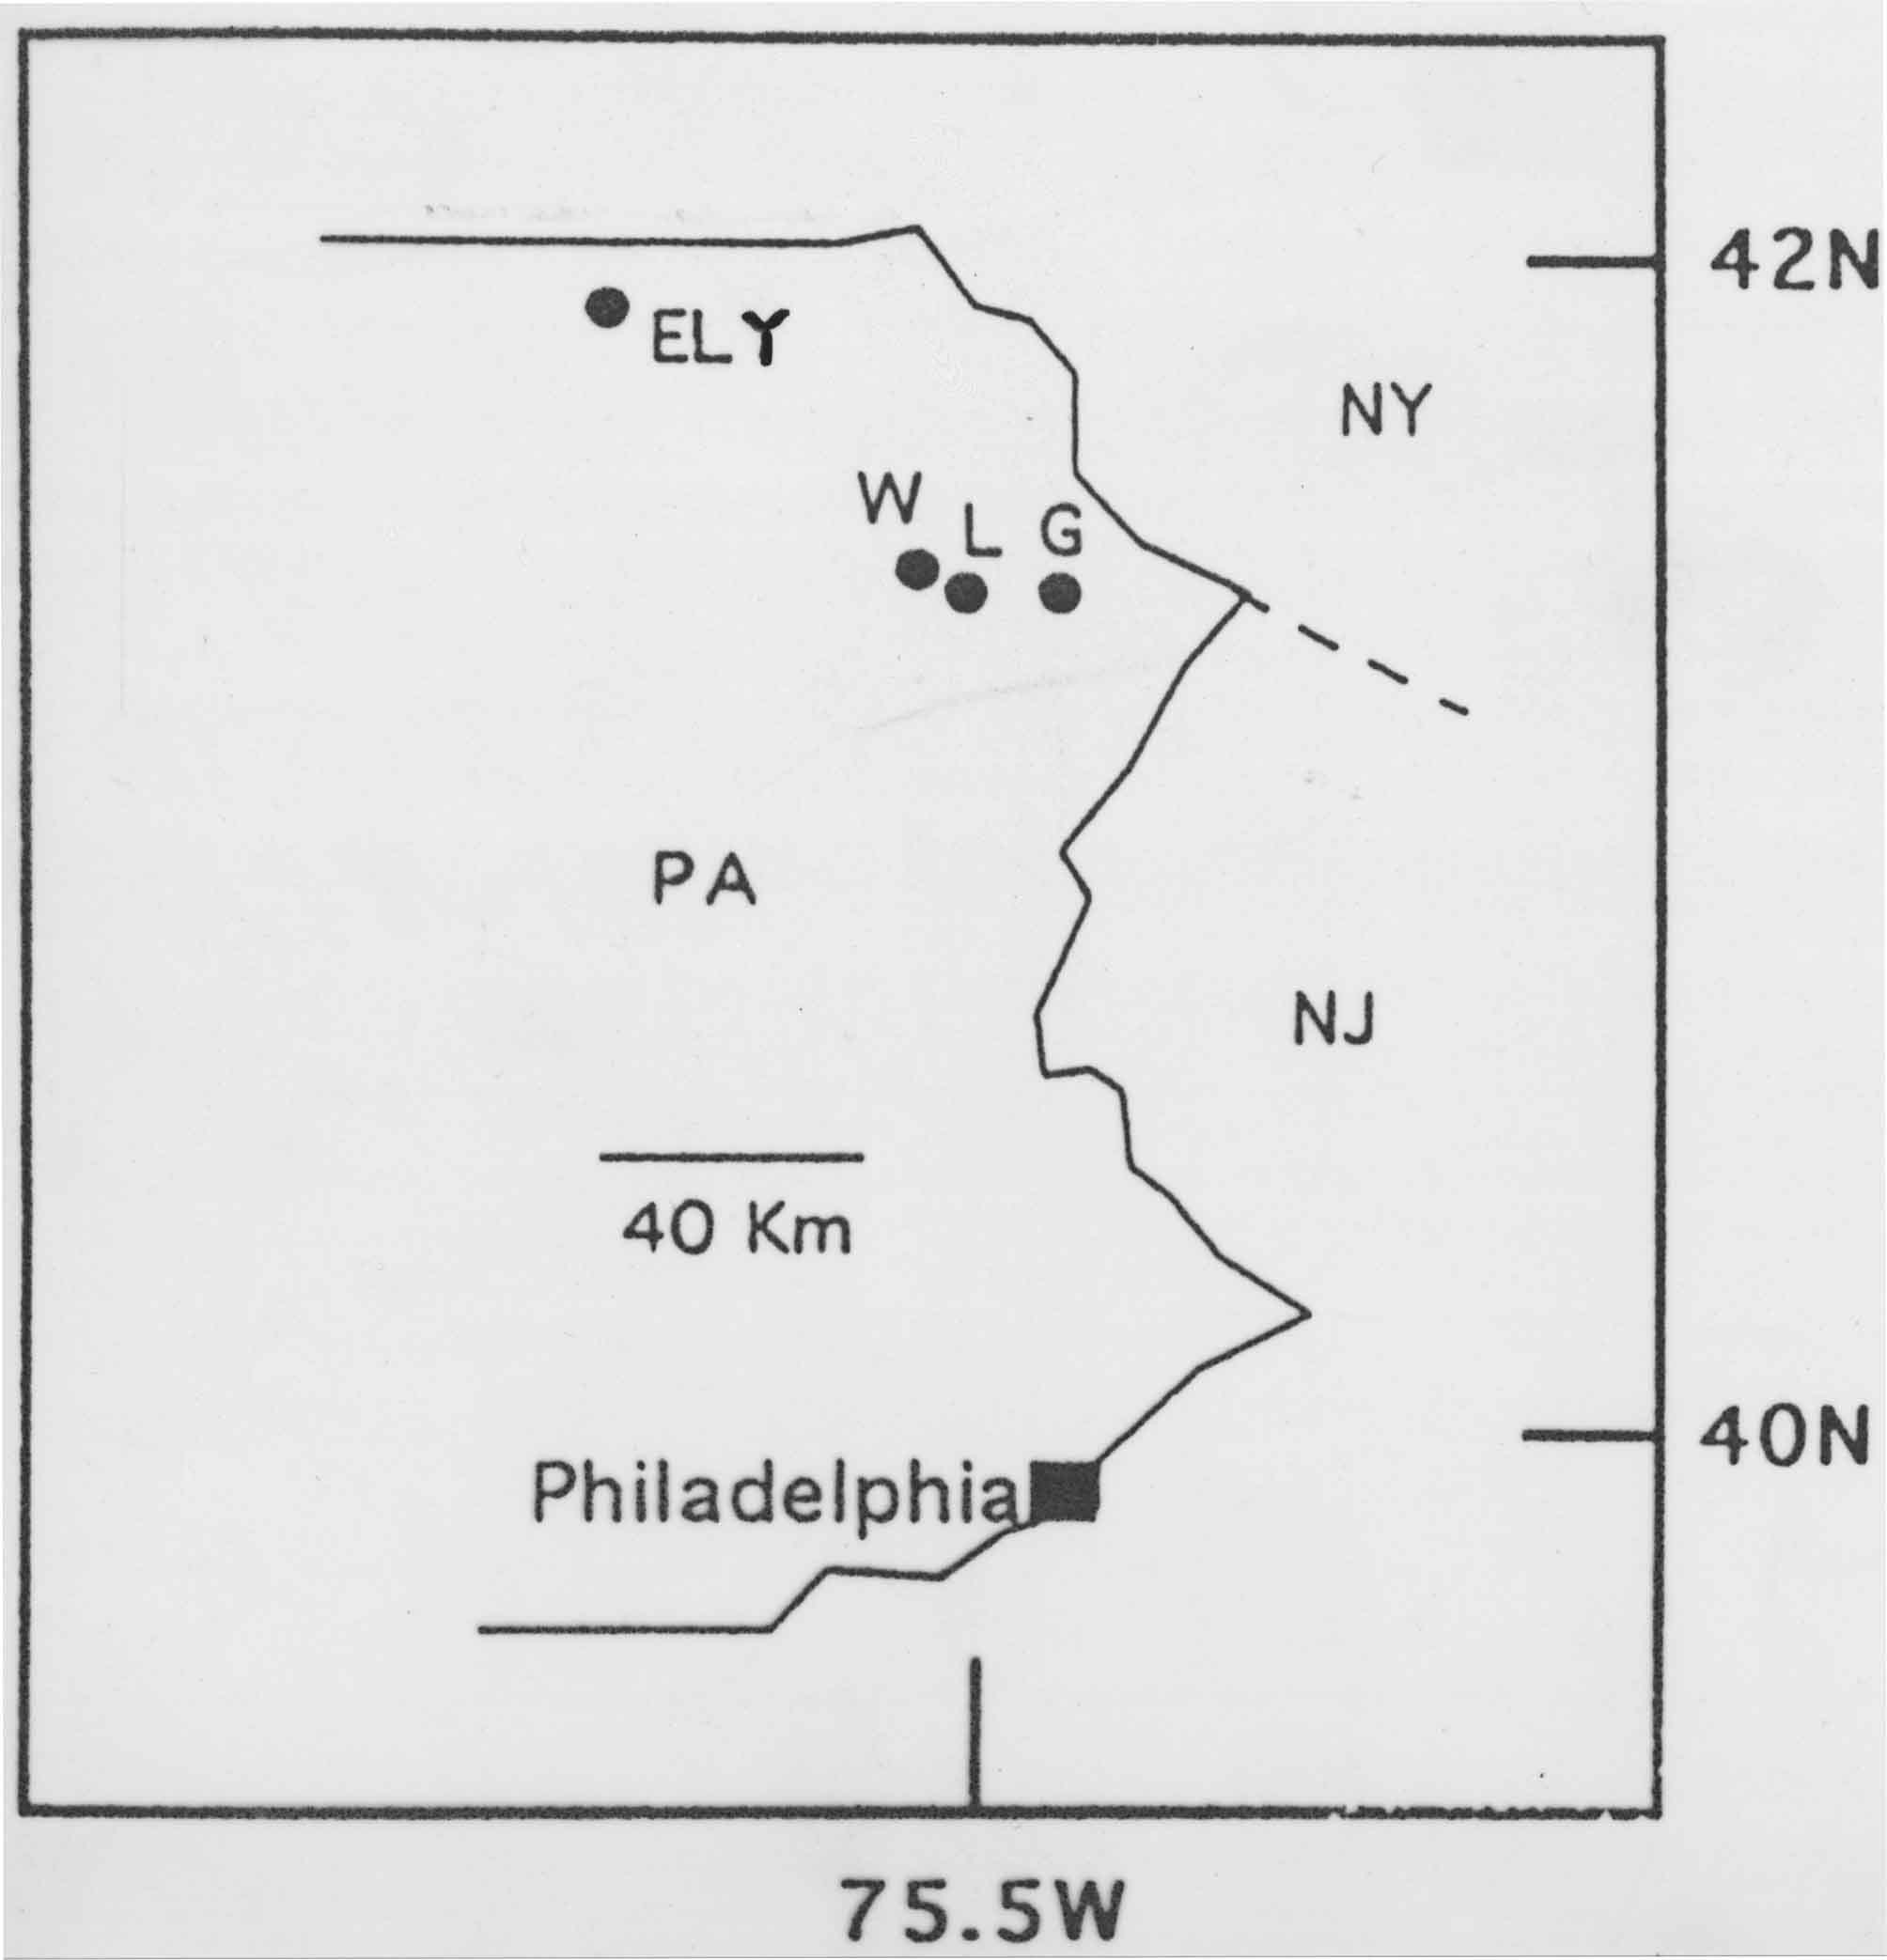
Early in 1997, a freeze core of lake sediments was collected from Ely Lake in Susquehanna County, Pennsylvania to determine whether a correlation exists between rainfall in the watershed and magnetic parameters in the lake sediments. Mineral magnetic studies have proven to be useful as environmental indicators in terrestrial settings, recording land-use changes in the watershed, and providing a method to correlate several cores from one lake basin (Kodama et al., 1997) (Thompson and Oldfield, 1986). Previous studies (see Dearing and Flower, 1982 and Kodama et al., 1997) have indicated a correlation does exist between rainfall and magnetic mineral concentration. Dearing and Flower (1982) correlated rainfall on a monthly scale with magnetic intensity in sediment traps at the bottom of Lough Neagh in Northern Ireland. They found a positive correlation between the monthly rainfall and the strength of the magnetic signal. This study provides strong evidence for a record of rainfall in the magnetics of lake sediments but takes place over a short time period and does not provide a reliable correlation between rainfall records over a long period and magnetic records over a similar period. Kodama et al (1997) correlated Gaussian filtered IRM intensities downcore with Gaussian filtered regional rainfall records over the last 120-250 years. Results from the Kodama study indicate a positive correlation exists between long-term rainfall and long-term IRM signal observed in the sediment record. In the Kodama study dating was done using 210Pb which does not provide an accurate enough age constraint. The aim of this study is to increase resolution in dating of the sediment by counting the annual varves of Ely Lake sediments. With more accurate ages, correlation of rainfall with magnetic parameters of the lake sediment can be better analyzed.
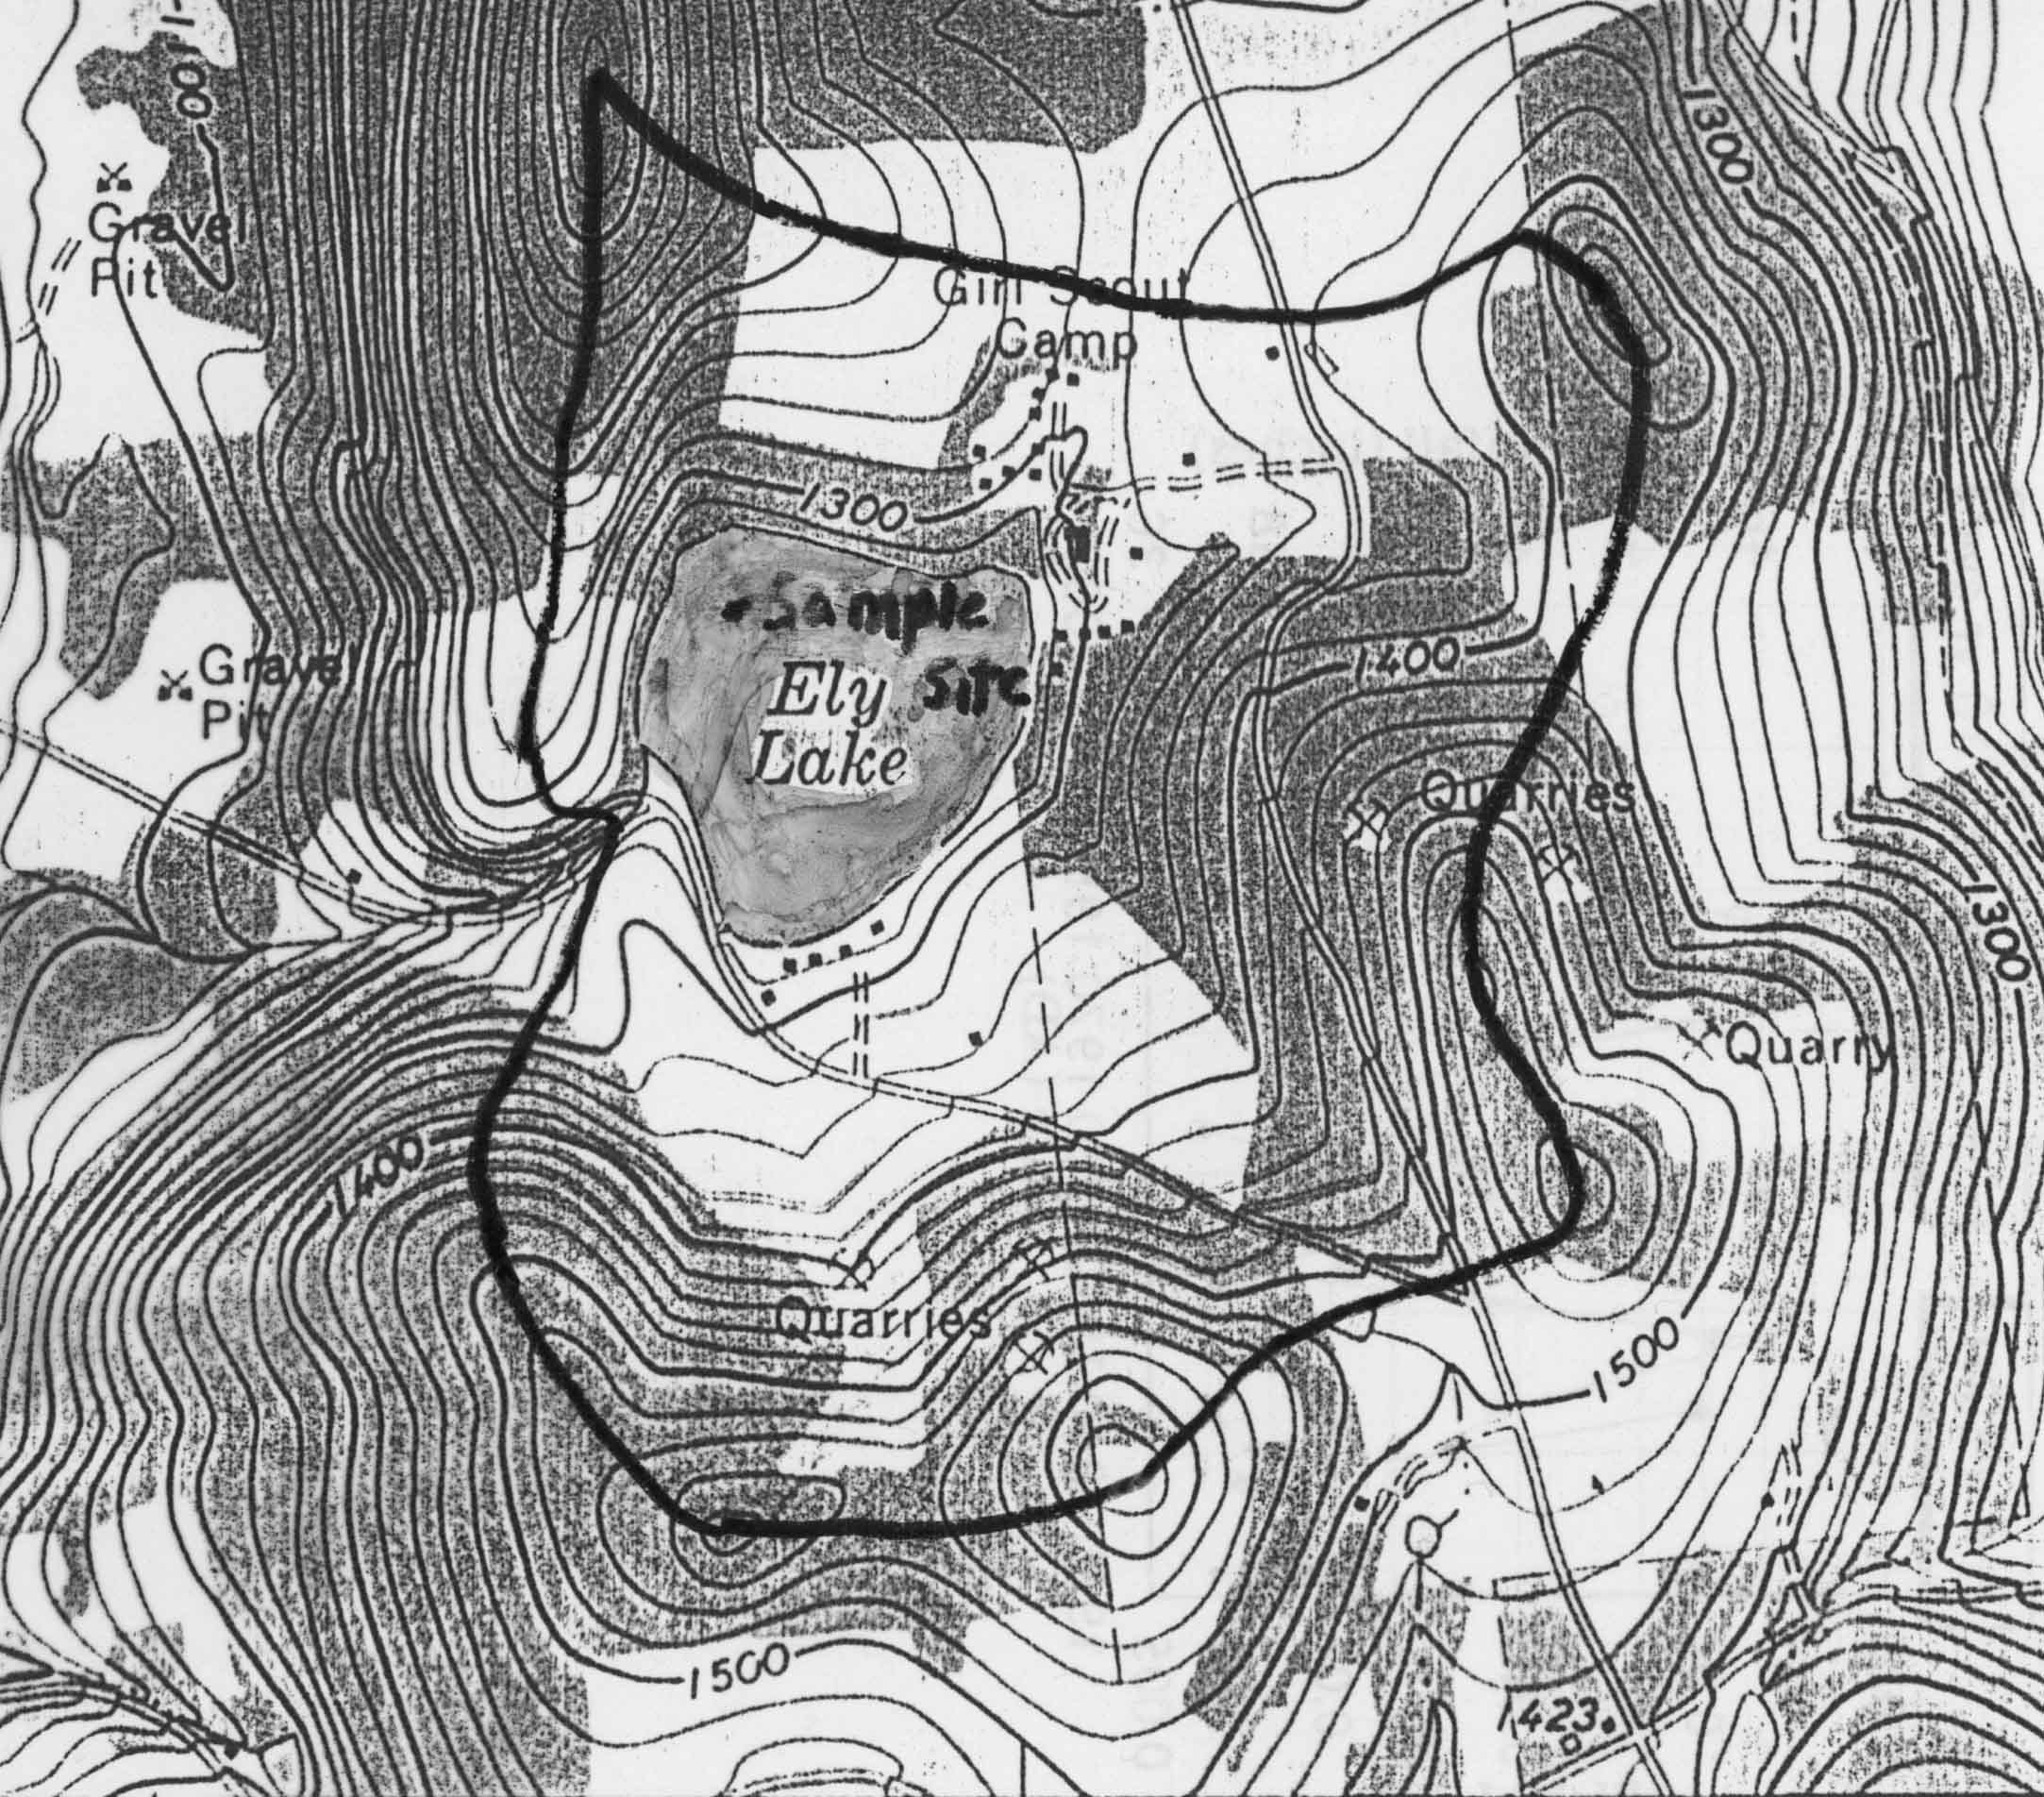
The watershed of Ely Lake is fairly small with steep topography
and several small inlet streams. The lake itself is relatively
deep for a lake of its size, reaching a maximum depth of around
25 meters near the sampling site. Little turnover due to sheltering
from the wind and resultant low oxygen levels and little biological
activity at the bottom of the lake provide optimal conditions
for annual varves to form in the lake sediments. These varves
appear as annual couplets of light and dark bands which provide
excellent age constraints downcore. First settlement and clearing
for agriculture within the watershed is not well documented however
historical records indicate the surrounding areas were settled
between 1814 and 1873 (see Blackman, 1873).
Fig. 1 |
Fig.2 |
Methods
Collection of the sediment was done using a freeze core technique (outlined in Wright, 1980 and Saarnisto, 1986) to prevent disturbance of the sediment. The core was collected at approximately the deepest part of the lake during the winter by drilling into the ice. An aluminum tube was filled with solid CO2 pellets, sealed with rubber, and weighted at the tip. The tube was dropped through the water column and into the sediments. It was left in place for about 15 minutes, allowing the sediments to freeze to the tube. After pulling up the tube, the frozen sediment core was kept frozen to prevent disturbance and oxidation until the varves could be counted. The core was photographed and varves counted and dated based on the assumption that the varves are annual light and dark couplets (i.e. one light and dark layer taken together represent a year of sediment. The core was then sectioned at approximately 10 year intervals for most of the core, and in 5 year intervals for the upper 70 years for a total of 75 samples representing 670 years.
Once sectioned and dated, the sediment sections were placed in 8 cm3 plastic sample boxes and dried at 30oC (just above room temperature). The samples were then weighed and several magnetic parameters measured. Magnetic susceptibility measurements were made using Sapphire Instruments SI-2 susceptibility meter with limited success due to low signal to noise ratio. Measurement of pARM (partial anhysteretic remanent magnetization), ARM (anhysteretic remanent magnetization), SIRM (IRM1.3T)(saturation isothermal remanent magnetization), and IRM-0.3T was done using a 2-axis CTF Systems, Inc. Superconducting magnetometer and normalized to dry sample weight. All IRMs and SIRMs we imparted using a ASC Model IM-10 impulse magnetizer.
| Magnetic Concentration | ||
|
|
|
Susceptibility, ARM, SIRM, and IRM-0.3T were measured
on all samples downcore whereas pARM and IRM acquisition were
measured only on selected representative samples. Thermal demagnetization
of SIRM in two sediment samples was also done at 50oC
intervals from 100 to 650oC. S-ratios (IRM-0.3T
/ SIRM) were also calculated for each sample to determine
magnetic mineralogy. Additionally, several soil samples were
taken from the surrounding watershed in an effort to determine
the source of the magnetic signal. ARM, SIRM, and IRM-0.3T
were measured on a topsoil sample, a subsoil sample, and two silt
samples from an inlet stream. Thermal demagnetization of SIRM
in these soil samples was also done at 50oC intervals
from 100oC to 700oC.
Results
The varves within the core show variable thickness from year to year, indicating heterogeneities in the lake conditions. In general, thickness of the varves increases upcore due to compaction of the older sediments and increased sedimentation in the last 160 years. Several distinct varve layers are also present and may record flooding events or periods of clearing within the watershed.
The plot of magnetic susceptibility (fig. 3) shows a general increase in intensity and variability after 1820 A.D. indicating a general increase in the concentration of magnetic minerals. The SIRM signal (fig. 4) also follows this general trend with a slow increase in the intensity of the signal observed from the bottom of the core until about 1820 A.D. The signal during this 500 year period shows only low-amplitude variations and increases from about 5 X 10⁻³ Am2kg-1 to about 1 X 10⁻² Am2kg-1 by 1820 A.D. After this period increased variability in the signal is seen. Signal variations of 0.9 X 10⁻² Am2kg-1 to 2.4 X 10⁻² Am2kg-1 occur in the last 10 years
The S ratio (IRM-0.3T / IRM1.3T )
(fig. 5) of the lake sediment downcore indicates the ratio of
low coercivity (e.g. magnetite) to high coercivity (e.g. hematite)
magnetic minerals. The S ratio also shows a marked change at
about 1820 A.D. Before this time we see very high (0.9 - 0.95)
S ratios with little variation over the 500 year period from 1320
to 1820 A.D. After this time, there is a moderate drop in S ratio
indicating an increase in the proportion of higher coercivity
magnetic minerals (such as hematite or goethite).
Fig. 6 |
Fig. 7 |
Results of pARM spectra measurements indicate fairly constant grain size throughout the core with a peak in magnetization occurring between 40 and 50 mT for all samples measured. IRM acquisition curves for the lake sediments indicate that saturation occurs around 200 mT for all but the top sample of the core, again suggesting a dominance of low coercivity magnetic minerals. The sample from the top of the core appears to approach saturation at 200 mT but continues to increase until about 1 T. This suggests a significant proportion of higher coercivity magnetic minerals present in the youngest sediments.
Results from the thermal demagnetization of SIRM in several lake sediment and soil samples indicate differences between the magnetic mineralogy of the lake sediments and the surrounding soils. The topsoil appears to be dominated by magnetite indicated by a strong signal above 550oC and a sharp drop to almost no signal at 600oC and above. The subsoil has both a magnetite phase, unblocking at 550oC to 600oC, and a hematite phase, unblocking at 650 oC to 700 oC. In the sediment samples there is evidence of the hematite phase in either the pre- or post-settlement horizons. The magnetite phase is present in both samples as well as a low temperature phase which demagnetizes at 150 - 200oC. This low temperature phase may be a sulfide magnetic mineral such as greigite but is not likely goethite due to the high S ratios seen in the pre-settlement horizon of the core.
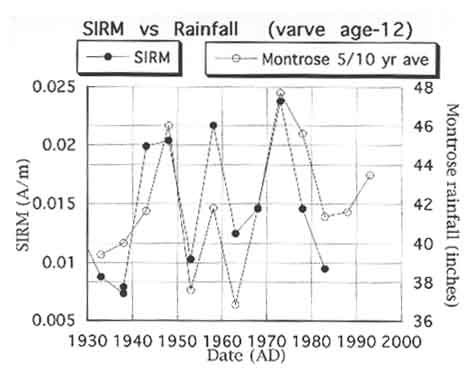
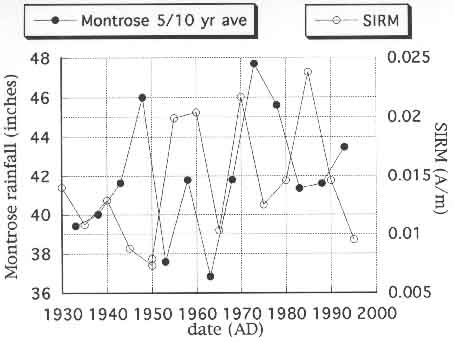
We compared the 5-year averaged rainfall and SIRM records in
an effort to correlate the two. We found similar shapes, but
no direct correlation (Fig. 9).
Discussion
It appears that doing the coring, we missed the top of the sediment record. It is not clear how much of the core is missing at the top, there are several possible ways to tie varve ages to real ages. One possibility is to look at the distinct changes seen in the magnetic record at about 1820 A.D. and correlate this to the time of first clearing in the watershed. Unfortunately, an exact date of clearing is not known. Certainly, it was after 1790 (the first recorded settlement in the area). Another possibility is to correlate a thick varve with a period of high rainfall in last 65 years. When comparing the 5-year averaged historical rainfall record and the averaged SIRM signal, we do see a 12 year offset in signals (fig. 10). This offset is likely due to disturbance of the sediment-water interface resulting in a loss of 12 years of sediment record. Once offset, the historical rainfall record over the last 65 years corresponds with the SIRM signal with a correlation coefficient of 0.72. This 12 year offset is certainly with the bounds of error in coring technique.
To explain the connection between SIRM signal intensities and rainfall, I propose the following model. In pre-settlement (pre 1820 A.D.) times we had a stable, wooded watershed with little erosional input from the surrounding soils. This allowed for a magnetite-like sulfide (e.g. greigite) to form in the water column. The signal from the magnetite-like sulfide is the cause of the high S-ratio and the low temperature phase during the thermal demagnetization of the lake sediments. This signal swamps any small erosional inputs from the watershed at this time and prevents direct correlation between rainfall and SIRM or other magnetic parameter. After clearing began in the early 1800's there was a marked increase in erosional inputs from both the topsoil and subsoil into the lake. After this disturbance of the watershed the magnetic concentration variations in the lake begin to record rainfall in the variations in the SIRM signal.
Because sulfide production in the lake swamps the magnetic signal from erosional inputs before settlement, we may consider imparting an SIRM then thermally demagnetizing the sediment to remove the low temperature sulfide at 250-350oC before measuring the remaining SIRM. Such a procedure should separate the sulfide signal from the magnetite and hematite signals. Assuming the magnetite and hematite signals are predominately erosional, this technique may allow for a better correlation between SIRM and historical rainfall and paleorainfall by removing the interfering sulfide signal.
Conclusion
A mineral magnetic study of Ely Lake in northeastern Pennsylvania indicates land use changes occurred within the catchment in the early 1800's. These land use changes are recorded in the magnetic signal of the lake sediments as increases in the variability and intensity of susceptibility and SIRM. Results suggest there is a good positive correlation between historic rainfall over the last 65 years and the SIRM signal over the same period assuming the loss of the top of the sediment record. Such a correlation may prove useful in reconstructing paleoenvironmental conditions of the region over a longer interval. While time is well constrained in the core due to the annual varves and this correlation is significant, the source of the magnetic signal before human settlement and disturbance of the watershed appears to shift from an erosional input to an in-situ sulfide input which swamps the erosional signal. While more study is clearly needed, one possible solution to the swamping of the erosional signal input would involve thermal demagnetization of sulfide before measurement of the SIRM signal for the pre-settlement horizon.
References
Blackman, E.C., 1873. History of Susquehanna County. Claxton,
Remson, and Haffelfinger, Philadelphia.
Dearing, J.A. and Flower, R.L., 1982. The magnetic susceptibility
of sedimenting material trapped in Lough Neagh, Northern Ireland
and its erosional significance. Limnology and Oceanography. 17:
p 969-975.
Kodama, K.P., Lyon, J.C., Siver, P.A., and Lott, A.M., 1997. A
mineral magnetic and scaled- chrysophyte paleolimnological study
of two northeastern Pennsylvania lakes: records of fly ash deposition,
land-use change, and paleorainfall. Journal of Paleolimnology.
17: p 173-189.
Saarnisto, M., 1986. Annually laminated lake sediments, in Berglund,
B.E. ed., Handbook of Holocene Palaeoecology and Palaeohydrology.
John Wiley and Sons. Ltd., New York, 869p.
Thompson, R. and Oldfield, 1986. Environmental Magnetism. Allen
and Unwin, London, 227p.
Wright, H.E., 1980. Cores of soft lake sediments. Boreas, 9, pp 107-114.