|
# FACTORS |
Chi-Square |
Pr >ChiSq |
AIC |
SBC |
Convergence Met? |
|
4 |
195.5723 |
<.0001 |
165.2624 |
97.92529 |
Convergence criterion satisfied. |
|
5 |
38.2274 |
<.0001 |
19.01715 |
-20.5929 |
Convergence criterion satisfied. |
|
6 |
6.2022 |
0.1845 |
-1.65851 |
-17.5025 |
Convergence criterion satisfied. |
|
7 |
Not enough DF to test this. |
Looking at the factor
loadings after the varimax rotation, we questioned whether factors 5 and 6
might be trivial. Even though it appeared these factors should not be
used, further investigation showed us that we need to keep Weight and
Width in the analysis and use six
factors.
Final Communalities
|
Variable |
Communality |
|
SRP |
1.00000 |
|
DealerCost |
0.99866
|
|
Engine |
0.97021 |
|
Cylinders |
0.88136 |
|
Hp |
0.84161 |
|
Cmpg |
0.99880 |
|
Hwympg |
0.93956 |
|
Weight |
0.97895 |
|
WheelBase |
0.89589 |
|
Length |
0.91377 |
|
Width |
0.79912 |
|
The estimated
communalities tell us the proportion of each variable that is explained by
the six common factors. These tell us that several of the variables have a
high proportion of their variabilities explained by the common
factors. |
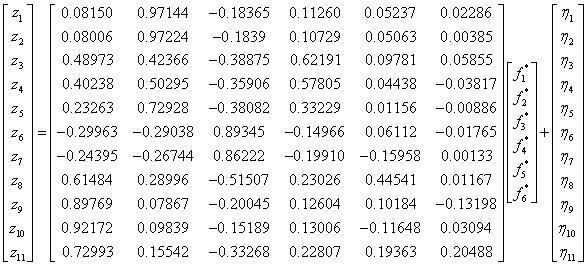
Final Factor Analysis Model
(Obtained through a Varimax Rotation)
|
Factor 1: This factor appears to be a measure of the size
of the vehicle. The primary variables are Weight, Wheelbase, Length and
Width.
Factor 2: This factor appears to be a measure of the
price/cost of the vehicle. The primary variables are SRP, Dealer Cost and
HP. We found the correlation between HP and SRP to be 0.835 and the
correlation between HP and Dealer Cost to be 0.833. This makes sense that
these variables would be highly correlated because vehicles with higher
HP, such as Sports cars, tend to be more expensive.
Factor 3: This factor appears to be a measure of gas
mileage of the vehicle. The primary variables are Cmpg and
Hwympg.
Factor 4: This factor appears to be a measure the �stuff
under the hood� for a vehicle. The primary variables are Engine and
Cylinders.
Factor 5: This factor appears to be a measure of the
weight of a vehicle.
Factor 6: This factor appears to
be a measure of vehicle
width. |
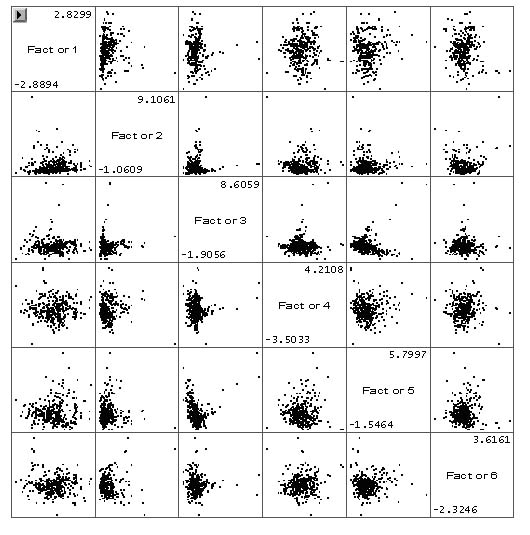
Scatterplot
Matrix
 |
|
From this we can see that our
factors do not seem to be correlated with one
another. |
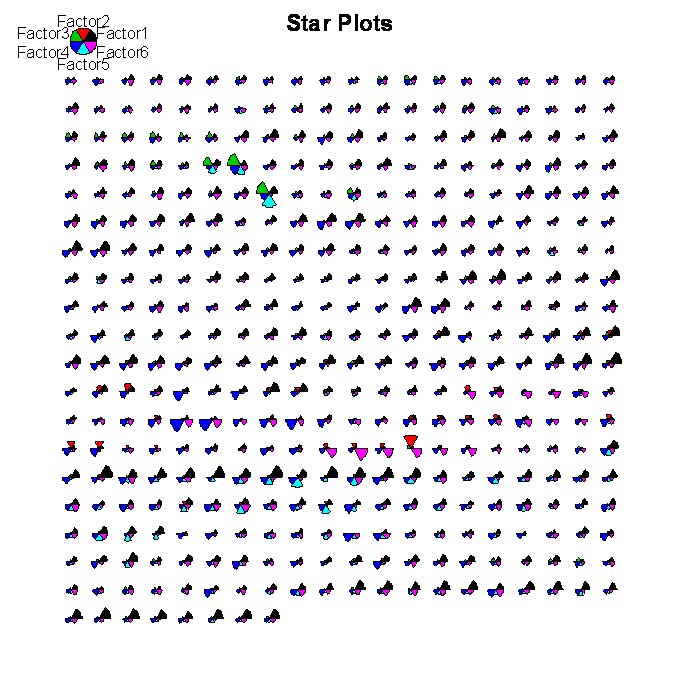
Star Plot
 |
|
The vehicles with the high
factor 3 and factor 5 scores are the Hybrids (Honda Civic Hybrid, Honda
Insight, and Toyota Prius). The Chevy Corvette, Chevy Corvette
Convertible, Chrysler Crossfire, Ford Mustang, Ford Mustang GT
Convertible, and Ford Thunderbird Deluxe have high factor 4 scores. The
Hummer H2 has a large factor 5 score. The vehicles with high factor 6
scores are the Porsche 911 Carrera Convertible, Porsche 911 Carrera 4S
Coupe, Porsche 911 Targa Coupe, and the lovely Porsche 911 GT2. The
Porsche 911 GT2 also has a large factor 2 score because of its high
price. |
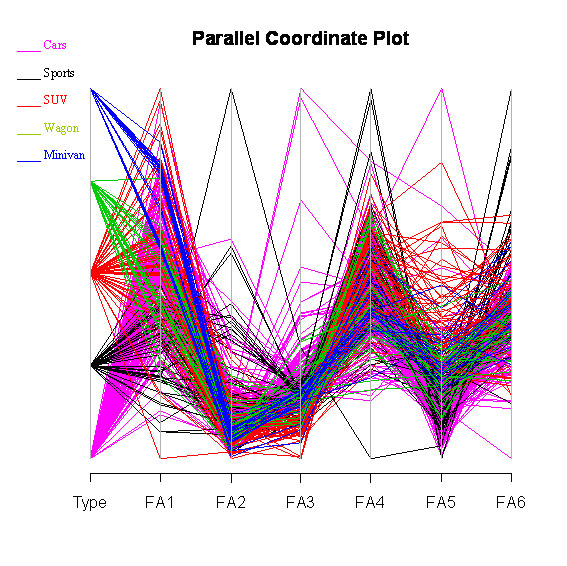
Parallel Coordinate Plot
 |
|
We conditioned the colors
on vehicle type. It appears from this parallel coordinate plot that the
minivans have low factor 2 scores, which measures price. We can also see
that the Porsche 911 GT2 has the largest factor 2. The vehicles with the
largest factor 3 scores are the hybrids. Factor 3 is a measure of gas
mileage, and these vehicles get the best mileage in our data. It appears
the minivans and some of the SUVs have large Factor 1 score which is a
measure of the overall size of the vehicle. The Sports cars tend to have
large factor 6 scores which is a measure of
Width. |