This activity involved linking voter
registration data with TIGER data
for Fitchburg, Massachusetts for analysis.
What areas of the city have the lowest
percentages of registered
voters?
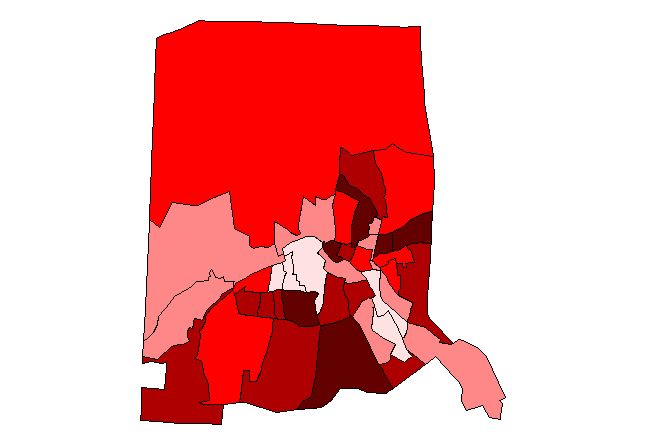
Figure 1. This image shows total voter registration by census block group, compared with total population. The highest proportion of registration can be found in the south central part of the city, but it is not a uniform pattern.
Is there any variation in party support within the city (i.e., Do different parties dominate different parts of the city)?
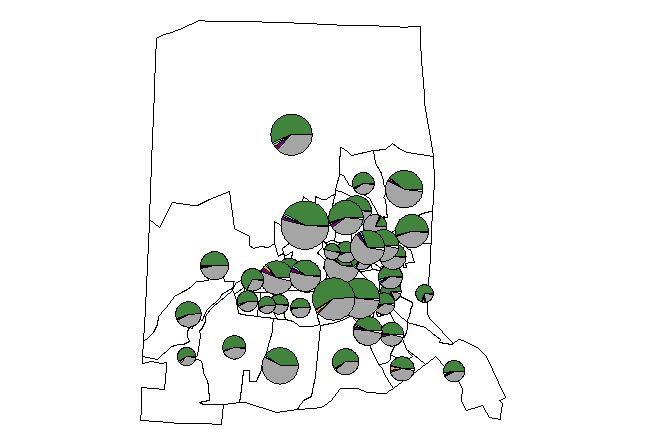
Figure 2. This chart shows
relative numbers of voters (by
size of individual pie charts) and the proportion
by party in each block
group. Mugwumps (green) and Whigs (gray) are
the leading parties in
each area, but Mugwumps tend to have greater
numbers in the north, and Whigs
in the south.
Should the Whigs invest in Spanish language flyers for the growing Hispanic population? If so, where should they distribute them?
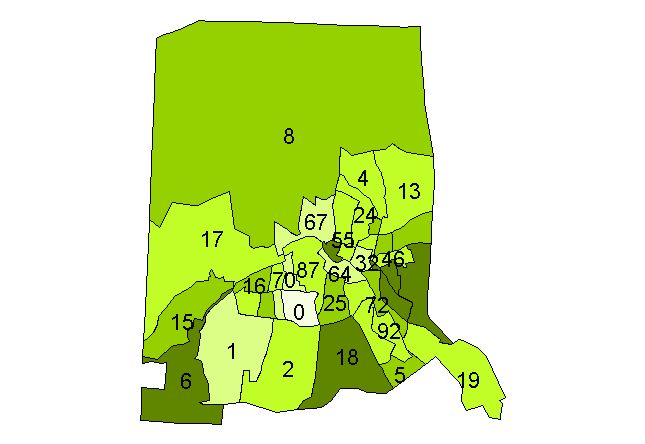
Figure 3: This image shows proportion of
Hispanic registration to
total Hispanic population. The number in
each block group is the total
number of Hispanic voters. The actual
numbers show that except in a
few areas in the central part of the city, there
are not significant numbers
of Hispanics registered, so it may be worthwhile
to invest in Spanish-language
flyers. There is no trend for proportion of
Hispanic registration,
except for a few block groups in the southern part
of the city. These
might make a good starting point for flyer
distribution.