Heating Curve For Water

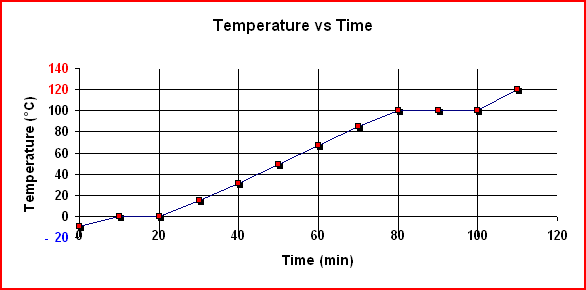
A heating curve is a graph of the temperature versus the amount of heat added for a particular substance under a constant pressure of 1.00 atm. A typical heating curve for a 1.00 g sample of water is shown below. Each diagonal line shows the heating of one phase (state) from a lower temperature to a higher one. During such heating, the kinetic and potential energies of the molecules increase. Each horizontal line shows the change of one phase to another at constant temperature. During such heating, all of the heat goes into increasing the potential energy of the molecules.
 |
To determine the enthalpy change for converting 1.00 g of ice at -20° C to water vapor at 120° C, the enthalpy change for each segment is determined. To determine the total enthalpy change, Hess's law is applied.
To compute the enthalpy change for each diagonal portion of the graph, the formula ΔH = mcΔT is used. Each diagonal portion represents a different phase of water and the corresponding specific heat must be used. For melting and boiling, the formulae ΔHfus = mLF and ΔHvap = mLV are used.
ΔH1 = miciΔTi = 1.00 g x 2.09 J/g-K x 20 K = 41.8 J = 0.0418 kJ
ΔH2 = miLF = 1.00 g H2O x 1 mol H2O/18.02 g H2O x 6.01 kJ/mol H2O = 0.334 kJ
ΔH3 = mwcwΔTw = 1.00 g x 4.18 J/g-K x 100 K = 418 J = 0.418 kJ
ΔH4 = mwLV = 1.00 g H2O x 1 mol H2O/18.02 g H2O x 40.67 kJ/mol H2O = 2.26 kJ
ΔH5 = mscsΔTs = 1.00 g x 1.84 J/g-K x 20 K = 36.8 J = 0.0368 kJ
ΔHT = ΔH1 + ΔH2 + ΔH3 + ΔH4 + ΔH5
ΔHT = 0.0418 kJ + 0.334 kJ + 0.418 kJ + 2.26 kJ + 0.0368 kJ = 3.09 kJ