Density And Error Analysis

Density is a measure of the quantity of mass of a substance per unit of volume. Because density can be measured without a chemical change taking place, it is a physical property. Density is also an intensive property because it does not depend on the amount of substance being measured. For this reason, density can be used to help identify an unknown substance.
Mathematically, density is expressed as D = M/V and has units of g/mL or g/cm3.
From the above equation, it is apparent that density is both temperature and pressure dependent. For liquids and solids, the density will change slightly with changes in temperature and pressure. Most solids and liquids expand when they are heated which increases their volume. The notable exception is water when it is heated from 0 °C to 4 °C because it contracts. Ignoring any slight evaporation, heating results in a decrease in density. Changes in pressure can increase or decrease the volume but the resulting change in density is negligible. Unless stated, the densities of solids and liquids are determined at room temperature, 25 °C.
The density of gases varies greatly depending on the temperature and pressure. To determine the density of a gas at STP (Standard Temperature And Pressure), the volume must be measured at STP. Standard temperature and pressure is 0 °C (273 K) and 1 atm (101.3 kPa, 760 mm).
The following mass and volume data was collected by using the water displacement method for six different pieces of copper. The density was calculated for each trial and the graph of Mass vs Volume is shown below.
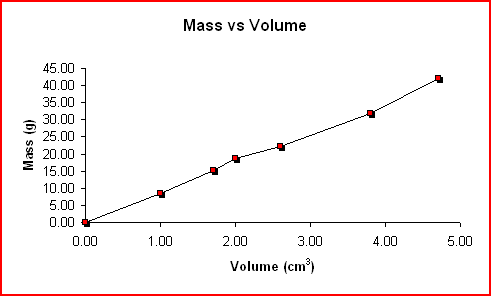 |
| Mass | Volume | Density |
|---|---|---|
(g) |
(cm3) |
(g/cm3) |
0.00 |
0.00 |
0.00 |
8.60 |
1.00 |
8.60 |
15.20 |
1.70 |
8.94 |
18.60 |
2.00 |
9.30 |
22.10 |
2.60 |
8.50 |
31.90 |
3.80 |
8.39 |
42.20 |
4.70 |
8.98 |
One method of reporting errors in measurement is by stating the accuracy of the measurements. Accuracy refers to the closeness of a measurement to the accepted value of the measurement. Percent error determines the accuracy of a set of measurements and is determined by the following expression:
%error = |O-A|/A x 100%
where O is the observed value and A is the accepted value.
The accepted value for the density of copper is 8.92 g/cm3 and the average of the densities calculated above is 8.78 g/cm3. Substituting these values into the expression above yields:
%error = |8.78 g/cm3 - 8.92 g/cm3|/8.92 g/cm3 x 100% = 1.6%
Another method of reporting errors is by stating the precision of the data. Precision refers to how close the measured values are to one another. The average or mean value of a set of data is calculated by dividing the sum of the data by the number of data values.
average (mean) value, Dave = (D1 + D2 + D3 + D4 + D5 + D6)/6
Dave = (8.60 + 8.94 + 9.30 + 8.50 + 8.39 + 8.98) g/cm3/6 = 8.78 g/cm3
The graph of Number Of Occurences vs Density shown below produce an error curve for low precision data. When errors are large resulting in low precision data, the data are more spread out and the curve is broader and less sharp.
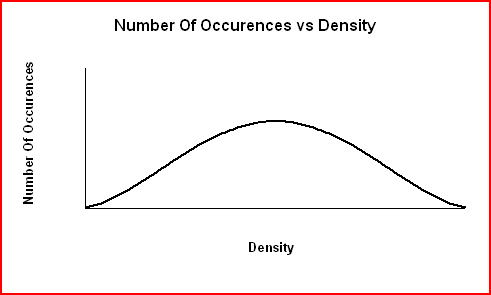 |
For high precision data, most values will be clustered around the average (although some will lie further away) and the curve is narrower and sharper.
Another method of stating the precision is calculating the standard deviation. Standard deviation is a measure of the width of the error curve and indicates the precision of the data.
To calculate the standard deviation, s, of the densities:
- Calculate the average or mean density, Dave.
- Subtract the mean from each density value.
- Square each of the differences and find the sum of the differences.
- Divide the sum of the squares by the number of density values, minus one (N-1).
- Take the square root of the result in the previous step.
Applying these steps to the measured densities and using Dave = 8.78 g/cm3 produce the following values:
D - Dave |
(D - Dave)2 |
|---|---|
(g/cm3) |
(g/cm3)2 |
-0.18 |
0.032 |
0.16 |
0.026 |
0.52 |
0.27 |
-0.28 |
0.078 |
-0.39 |
0.15 |
0.20 |
0.040 |
The formula for standard deviation is given by:
s = √((Σ(D - Dave)2)/(N-1))
Substituting the table values yield:
s = √)(0.0322+0.0262+0.272+0.0782+0.152+0.0402+/5) = 0.345 g/cm3
The smaller the standard deviation, s, the closer the density values are to the average density while a large standard deviation means the density values lie further from the mean. The following graph shows that when errors are large (less precise data), the data are more spread out and the error curve is broader and less sharp.
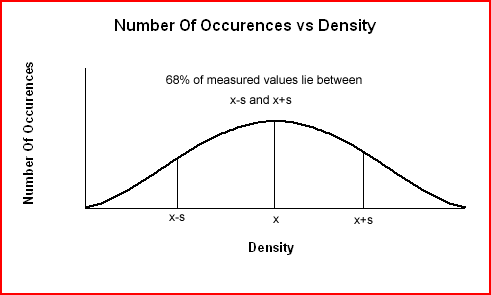 |
The standard deviation for the density data is 0.345 g/cm3. Standard deviation always has the same units as the original data. A standard deviation of 0.345 g/cm3 means that 68% of subsequent density measurements will lie within ± 0.346 g/cm3 of the average value (± 1 standard deviation). The values will lie in the range:
8.43 g/cm3 ≤ 8.78 g/cm3 ≤ 9.13 g/cm3
It also means that 95% of further density values will lie within ± 2(0.346 g/cm3) or 0.652 g/cm3 of the average value (± 2 standard deviations). The values will lie in the range:
8.09 g/cm3 ≤ 8.78 g/cm3 ≤ 9.47 g/cm3
Calculating the standard deviation for larger samples of data tend to be tedious and error prone so it is more efficient to use Microsoft Excel or a TI graphing calculator with statistical capabilities.
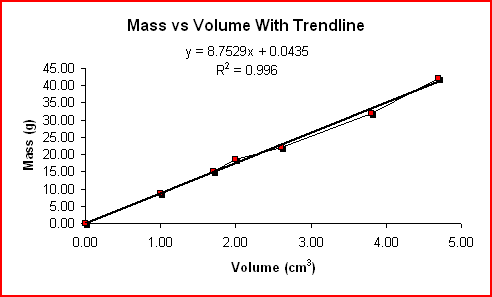
Another method of reporting errors is regression analysis. Regression analysis is finding the straight line or smooth curve that best fits the data. The graph does not have to pass through all the points nor does it have to pass through any of the points. Ideally, the graph should pass as closely as possible to all of them except for the outliers.
The formula for a linear relationship between x and y is:
y = mx + b
where m is the slope and b is the y-intercept.
The slope of the line, which is usually of greatest interest, is determined by the expression:
m = Δy/Δx = y2 - y1/x2 - x1
When using a TI graphing calculator and/or Microsoft Excel there is slightly different terminology. The TI calls searching for the line of best fit regression and Excel calls it a trendline. When using earlier TI's, TI-82, or Excel, the correlation factor, r, is also reported. The correlation factor, r, is always between -1 and +1. The closer the r value is to +1 or -1, the more of a linear relationship that exists between x and y. It is generally agreed that an acceptable range for r is:
0.6 ≤ r ≤ -0.6
The correlation factor is a dimensionless (unitless) value.
The linear regression or trendline for the Mass vs Volume values is shown below.
 |
Many times, one of the measured values will appear to greatly differ from the others. Suppose the last value in the data table was 9.91 g/cm3 as shown below.
| Mass | Volume | Density |
|---|---|---|
(g) |
(cm3) |
(g/cm3) |
0.00 |
0.00 |
0.00 |
8.60 |
1.00 |
8.60 |
15.20 |
1.70 |
8.94 |
18.60 |
2.00 |
9.30 |
22.10 |
2.60 |
8.50 |
31.90 |
3.80 |
8.39 |
45.60 |
4.60 |
9.91 |
The second five values are in agreement but the last value seems very different. Before discarding the last value, a Q-Test should be applied to the most deviant value. The Q-Test is given by:
Q = |deviant result - nearest neighbor|/range of measured values
The most deviant density value is 9.91 g/cm3 and the closest density value is 9.30 g/cm3.
The range of the data is the difference between the largest density 9.91 g/cm3 and the smallest density 8.39 g/cm3. Q is calculated to be:
Q = (9.91 g/cm3 - 9.30 g/cm3)/(9.91 g/cm3 - 8.39 g/cm3) = 0.40
The Q value of 0.40 is compared to a listing of standard Q values shown below. The abbreviated table of standard Q-90 values indicates when a deviant value may be rejected with 90% confidence that the deviant result is in error.
| Number Of Trials | Q-90 |
|---|---|
2 |
--- |
3 |
0.94 |
4 |
0.76 |
5 |
0.64 |
6 |
0.56 |
7 |
0.51 |
8 |
0.47 |
9 |
0.44 |
10 |
0.41 |
If the Q value is larger than the table value of Q, the deviant result should be discarded before any calculations of the mean or standard deviation are performed. In this example, there were six measurements (Q = 0.56) and the calculated Q value was 0.40. Because the Q value is smaller than the table value of Q, the density of 9.91 g/cm3 should be included in subsequent calculations.