The following two tables are from DOT HS 809 271 Technical Report: Recent Trends in Fatal Motorcycle Crashes.
| Table 23: Motorcyclist Fatalities by Age Group and Year (1980, 1985, 1990, and 1998) | ||||||||
| Age Group | 1980 | 1985 | 1990 | 1998 | ||||
| Number | Pct | Number | Pct | Number | Pct | Number | Pct | |
| Under 25 | 2,793 | 54 | 2,297 | 50 | 1,294 | 40 | 564 | 25 |
| 25-29 | 967 | 19 | 970 | 21 | 667 | 21 | 357 | 16 |
| 30-39 | 920 | 18 | 861 | 19 | 816 | 25 | 612 | 27 |
| 40 and Over | 460 | 9 | 431 | 9 | 466 | 14 | 760 | 33 |
| Unknown | 4 | 0 | 5 | 0 | 1 | 0 | 1 | 0 |
| Mean Age (Years) | 26.2 | 26.8 | 29.3 | 34.6 | ||||
|
Table 24: Ratio of Fatality Percentage to Ownership Percentage by Age Group and Year (1980, 1985, 1990 and 1998) | ||||
| Age Group | 1980 | 1985 | 1990 | 1998 |
| Under 25 | 1.1104 | 1.4138 | 1.6761 | 1.6728 |
| 25-29 | 1.3239 | 1.1364 | 1.2023 | 1.4275 |
| 30-39 | 0.9411 | 0.8387 | 0.8192 | 0.9702 |
| 40 and Over | 0.5921 | 0.8387 | 0.5439 | 0.7581 |
In order to calculate fatality rates based on ownership, data were used from MIC�s 2000 Motorcycle Statistical Annual. These data were available for 1980, 1985, 1990, and 1998 and were given as percentage of ownership by age groups. Rates are calculated by dividing the fatality percentage (numerator) by ownership percentage (denominator) for the specific age group. Since actual numbers of owners by the age group were not available, this method of calculating the rates was used.
The following tables were created by using various data available from DOT HS 809 271.
Table 1 is a subset of data in Table 2 of DOT HS 809 271.
|
Table 1: Registered Motorcycles and Fatality Rate for All Ages (1980, 1985, 1990 and 1998) | ||||
| 1980 | 1985 | 1990 | 1998 | |
| Registered Motorcycles | 5,693,940 | 5,444,404 | 4,259,462 | 3,879,450 |
| Fatality Rate (Per 100,000) |
90.34 | 83.83 | 76.16 | 59.13 |
| Table 2: Motorcyclist Fatalities by Age Group and Year (1980, 1985, 1990, and 1998) | ||||||||
| Age Group | 1980 | 1985 | 1990 | 1998 | ||||
| Number | Pct | Number | Pct | Number | Pct | Number | Pct | |
| Under 25 | 2,794.00 | 54.32 | 2,298.25 | 50.39 | 1,294.25 | 39.90 | 564.25 | 24.60 |
| 25-29 | 968.00 | 18.82 | 971.25 | 21.28 | 667.25 | 20.57 | 357.25 | 15.57 |
| 30-39 | 921.00 | 17.90 | 862.25 | 18.89 | 816.25 | 25.16 | 612.25 | 26.69 |
| 40 and Over | 461.00 | 8.96 | 432.25 | 9.47 | 466.25 | 14.37 | 760.25 | 33.14 |
|
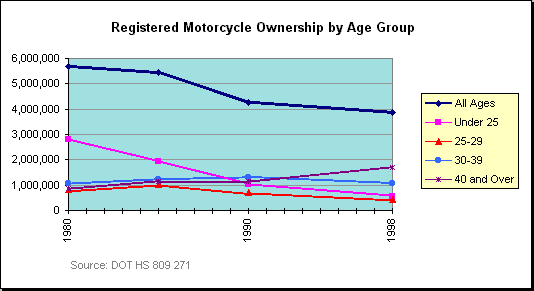
Table 3: Registered Motorcycle Ownership by Age Group and Year (1980, 1985, 1990 and 1998) | ||||
| Age Group | 1980 | 1985 | 1990 | 1998 |
| Under 25 | 2,785,216 | 1,939,162 | 1,013,893 | 570,433 |
| 25-29 | 809,342 | 1,019,541 | 728,701 | 423,227 |
| 30-39 | 1,083,268 | 1,226,398 | 1,308,299 | 1,067,196 |
| 40 and Over | 861,822 | 1,163,429 | 1,125,573 | 1,695,925 |
|
Table 4: Fatality Rate by Age Group and Year (per 100,000
registered motorcycles) (1980, 1985, 1990 and 1998) | ||||
| Age Group | 1980 | 1985 | 1990 | 1998 |
| Under 25 | 100.32 | 118.52 | 127.65 | 98.92 |
| 25-29 | 119.60 | 95.26 | 91.56 | 84.41 |
| 30-39 | 85.02 | 70.31 | 62.39 | 57.37 |
| 40 and Over | 53.49 | 37.15 | 41.42 | 44.83 |
The following charts plot the numbers in Table 1, Table 2, Table 3, and Table 4. The fatality
rate in the chart "Fatality Rate by Age Group" is per 100,000
registered motorcycles.
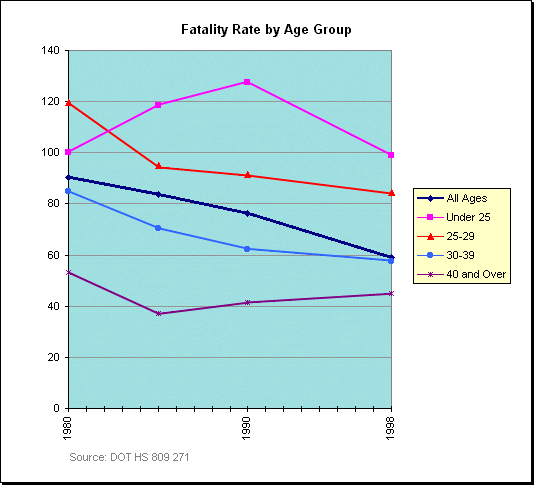
Yes, as the media wants us to believe, the fatality rate for older riders (the age group:
40 and over) has been
on the rise while those of other age groups have been declining (at least until 1998);
however, the fatality rates of older age groups are still considerably lower than those
of younger age groups.