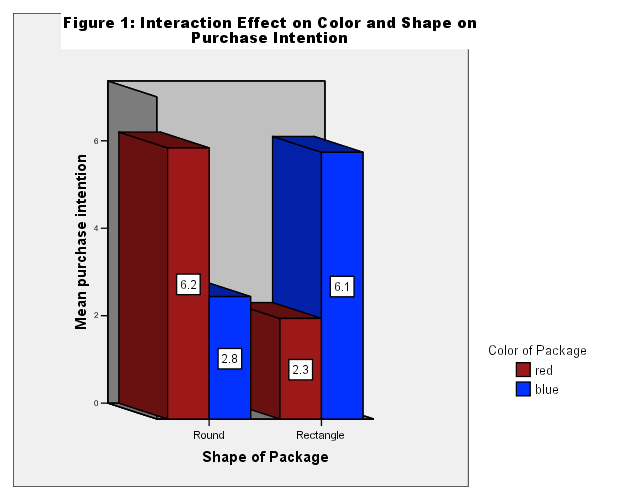
| This is the most interesting graph for project 4. This graph shows the interaction effect on color and shape on purchase intention. I find it interesting because the graph looks like a mirror image of itself except for the color. Respondents liked the red-round package with a mean of 6.2 over the blue-round package. Respondents also liked the blue-rectangle package with a mean of 6.1 over the red-rectangle package. The results will make it difficult for managers to decide which shape and color to make their package. |