Statistics of the Blueberries of Opportunity’s first 310 Sols,
By Henry Wallace [email protected] , Marsman , and Denis
Royer [email protected] ,
and by the many contributors to the “Go Measure…” Thread [1].
ABSTRACT: All
Martian Blueberries micro-photographed by the
Opportunity rover during the first 310 Sols were carefully measured and
analyzed. They present two distinct populations, separated both statistically
and geographically. The statistics of both populations are best represented not
by a Gaussian or Normal distribution, but by two variants of the Asymmetric
Logistic Peak function.
MATERIALS AND METHODS: The Microscopic Imager (MI) is one of three cameras
carried by Opportunity and takes close-up photographs of a standard area 1.2
in. (30.7 mm ) on each side, representing 1024 by 1024 pixels in the standard
MI image published on the Internet by NASA/JPL [2]. All MI images taken between Sol 1 and Sol 310 were studied, and
all available MI images with blueberries that met our criteria up through Mars
Sol 310 were included in our sample. Measurements were taken of the maximum
major diameter of each spherule. A conservative set of rules was developed and
followed to assure consistent choice and measurement of blueberries [3]. Every
MI image with blueberries was examined; Only whole, unbroken spherules were
selected for measurement; Diameters were measured in pixels, then converted
into millimeters by multiplying pixels by 0.03; Where there were multiple
images of any spherule or group of spherules the image with the best focus only
was selected for measurement. Generally, only spherules above 1.2 mm in diameter were
tabulated to ensure that sand grains or small near-spherical rocks were
excluded from our sample. There were 474 blueberries included in our overall
sample. There were two principal sources of potential error; focus errors from
the MI camera (c. 10%) and the human error from interpreting the pixel edges in
the MI images. The assumption was made that areas for MI imaging were randomly
chosen by NASA
Up through
and including Sol 310, Opportunity used its Microscopic Imager on a total of
137 Sols. From these 137 Sols we were able to collect a total of 474 berries
Fig. 1:
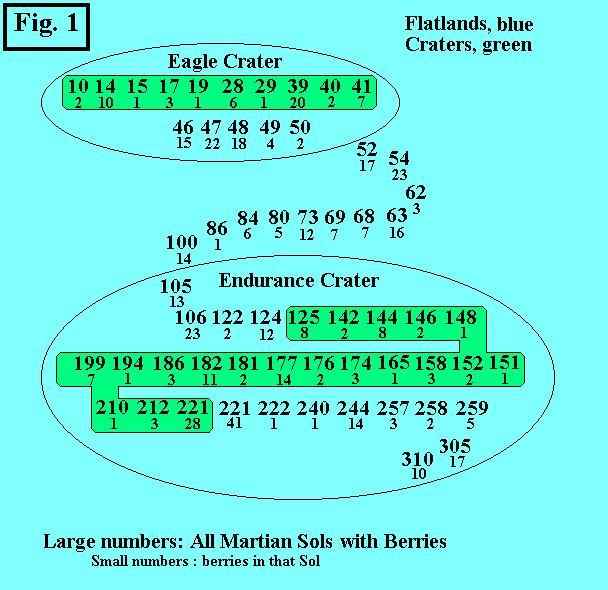
As shown
in this Figure, and based on NASA documents [4], certain Sols were considered
to be internal to either Eagle Crater or Endurance Crater. We grouped the
berries collected in either of these craters into one population of 150
berries, which we called “Craters”, and the remaining 324 berries were grouped
into a second population which we called “Flatlands”.
We want to
stress that the Crater berries were collected sequentially, with but one “skip”
between Eagle and Endurance. We consider the geographical region from which the
Crater berries were collected to be a long, thin meandering strip of Martian
soil which traces Opportunity’s path. There is but the one discontinuity in
this strip, the one between Eagle Crater and Endurance Crater. We consider this
strip to be geographically
separated from the other segmented strip which contains the Flatlands berries.
Because Sol 221 contained three times as many berries as the next most populous
Sol, we chose to divide its 69 berries: the first 28 into Craters and the
second 41 into Flatlands.
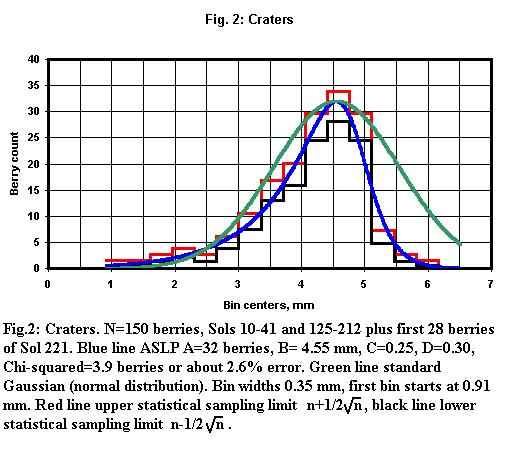
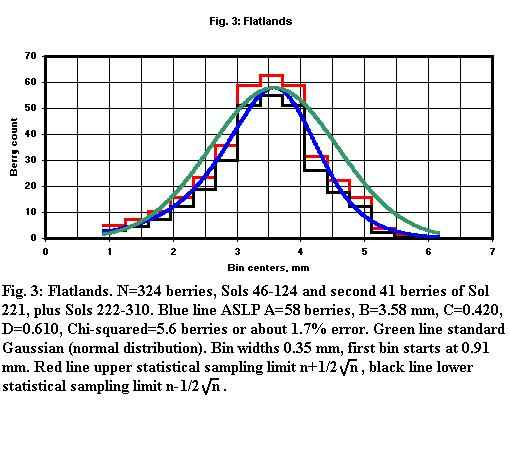
The results of our statistical analysis of the
blueberry diameters showed two distinct populations, separated both
statistically and geographically. Each group demonstrated a “tightness” or
clustering around peak diameters of
4.55 mm and 3.58 mm respectively. See Fig. [2] and [3]. In both populations,
particularly Craters, the distributions were tighter than a standard Gaussian
(Normal distribution) population.
Crater berries particularly also showed a “hard limit” of size
distribution at the high end. No spherules
were found above 6.02 mm.
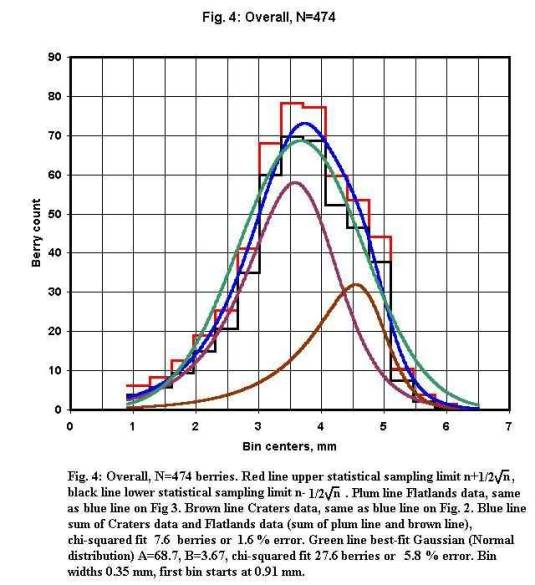
When the two populations are combined, Fig. [4]
results. An interesting observation may be drawn from this Figure. Note that,
at first glance, the data might be thought to be well fitted by the Normally
distributed standard Gaussian, the green line. This green line is the “best
fit” standard Gaussian, and its chi-square fit with the histograms is fairly
close, at 5.8% error. Note, however, that the combined ASLP functions from
Craters and Flatlands (blue line) achieves a much closer fit, at only 1.6%
error. Thus the “first glance” impression of a Gaussian fit with the overall
data is found to be in error, an error caused by the similarity of the blue
line and the green line.
Tests applied only to the overall data fail to yield two
distinct populations. This is because, when all the data is included in one
geographical “box”, the 474 berries is too small a sample to fully resolve the
two distinct populations. However the geographical separation shown here provides
two “boxes”, one of 150 samples containing overwhelmingly only the larger
Crater berries, and the other of 324 samples containing overwhelmingly only the
smaller Flatlands berries. The question might be posed, “How certain are we of the
location of the two peaks, one centered at 3.58 mm and the other at 4.55 mm,
and could they possibly overlap into just one peak, and thus represent only a
single population?” To answer, we point out that the 4.55 mm peak is supported
by the 150 samples from Craters and the 3.58 mm peak is supported by the 324
berries from Flatlands. By the Central Limit Theorem, 150 samples can “place”
the 4.55 mm peak to within about 8.16%, or about 0.37 mm. Thus this peak is
between 4.18 mm and 4.92 mm. Similarly the 324 sample size can place the other peak to within
about 5.5%, or about 0.20 mm, or between 3.38 mm and 3.78 mm. Thus there is a
minimum separation between the two peaks of 0.4 mm, supporting the fact of two
distinct populations.
We found both berry populations to be well fitted
by an Asymmetric Logistic Peak function (ASLP) [5]:
.
![]()
The ASLP is a function of x (mm) and of the four constants a, b,
c, d. The ASLP has a peak of amplitude a (berries, in these cases) located at
the position b (mm). Note that Craters was best fitted by a=32, b=4.55 mm,
c=0.25 and d=0.30. Flatlands was best supported by an ASLP with a=58, b=3.58 mm, c=0.42 and d=0.61.
The ASLP is often used by biologists in defining crop growth. See,
for instance, [6].
Denis Royer [7] made blueberry
diameter measurements from Sol 188 and 202 Opportunity Panoramic Camera image
using the pattern recognition software, ImageJ. In his study 1,875 blueberries
were analyzed. The statistical results from his study confirm our results from the MI images reported here.
DISCUSSION:
The berries from the combined Eagle and Endurance
craters constitute the population of “larger” berries while the remainder of the
berries constitute the “smaller” berries. R. Lewis has long maintained the
existence of at least two populations, and was the first to suggest the
possibility of multiple populations. It is possible that the berries originally
formed in the larger 4.55 mm diameter Fig [1] and subsequent wear or weathering
reduced them to the 3.58 mm diameter Fig [2]. One speculation to account
for this difference was that it might be related to differences in exposure to
wind or ionizing
radiation in the two environments and that the berries on the
flatlands are less protected and therefore more weathered. Berry diameters
would therefore tend to be higher in the relatively deep Craters than on the
shallow Flatlands.
An Excel file of the raw data used in all
computations is posted [8].
SELECTED REFERENCES:
[1] Our Web page hosting long report
http://www.markcarey.com/mars/discuss-17077-go-measure.html
[2]
http://marsrovers.jpl.nasa.gov/gallery/all/opportunity.html
[3]
Mars Spherule Data Base at http://geocities.com/rlewis6/Spherule_Database.htm
[4] http://marsrovers.jpl.nasa.gov/mission/status_opportunityAll.html
[5] Systat statistical software http://www.systat.com/products/TableCurve2D/help/?sec=1076
[6] Royo, C., Blanco, R, Triticale: growth analysis of
five spring and five winter triticale genotypes, Agronomy Journal, Vol 91,
Issue 2 305-311, American Society of Agronomy, 1999. Download .pdf at http://agron.scijournals.org/cgi/reprint/91/2/305
[7] Denis Royer webpage
http://perso.club-internet.fr/droyer/mars/mars1_000001.htm
[8]
Excel file of spherule data Berry# /
Sol / diameter, mm http://www.abcsite1.com/data/mars_as_collected_N_is_473.xls
[9]
Squyers, S.W. et al 2004, Science 3063, 1698-1703
[10]
Marjorie A. Chan et al, 2nd Conference on early Mars (2004),
8012.pdf.
ACKNOWLEDEMENTS; Ian ( [email protected]
) and Blair [email protected]
for their help
with statistical error analysis; to several Mars Blog Forum participants who
directly assisted in the collection,
hosting of data, or analysis of the
blueberry data, particularly R. Lewis, [email protected]
, who hosts the Mars Spherule Data Base at http://geocities.com/rlewis6/Spherule_Database.htm, Robert E. Page Jr., http://www.lipfordm.com/wtsi/RPage/RPage.htm
, and Hortonaheardwho at (http://www.lipfordm.com); to other Forum
participants for their supportive as well as critical comments in our Internet
peer review process; to Richard Baumeister and Mark Carey for moderating and
providing the Mars Forum respectively, (http://www.markcarey.com/mars/mars-forum/forum.html) and to NASA/JPL for publishing the images
without which this work would have been impossible.