Introduction
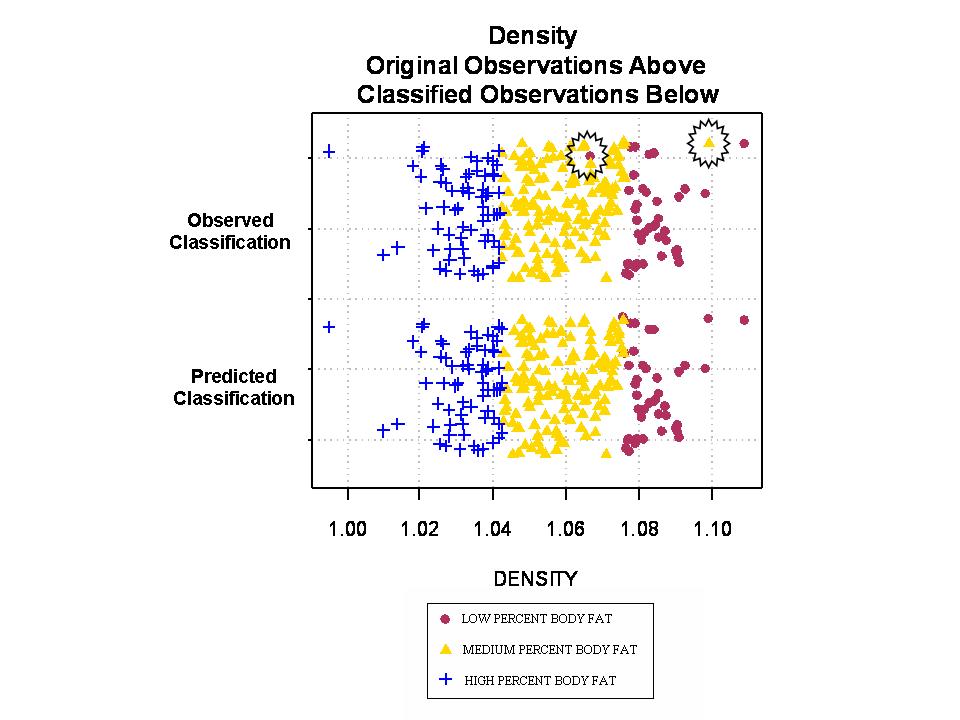
For this project, we are continuing the investigation of percent body fat of males and density, weight, height, age, and upper body variables such as chest, neck, bicep, forearm, and wrist circumference.
This project was designed to find a model that would best discriminate between low, medium, and high body fat bands. We defined low body fat as less than 10%, medium body fat as between 10% and 25%, and high body fat as above 25%. We are interested in finding a model that will give us low misclassification error rates as well as low overall error rates. We will test the normal method with both pooled and unpooled using priors proportional as well as the nearest neighbor method with k = 1 - 5. To conduct our analysis we will use the proc discrim function in SAS 9.1.
The data set can be found at percentbodyfat.html
**********************************************************************Summary of Discriminant Analysis Method
Back to Homepage homepage.html
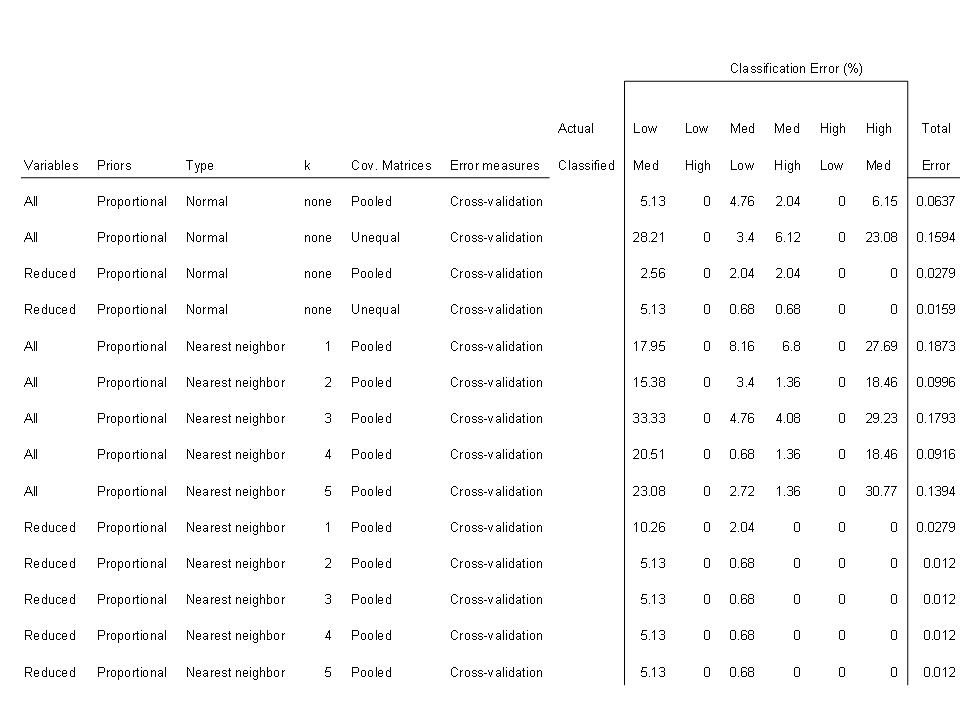
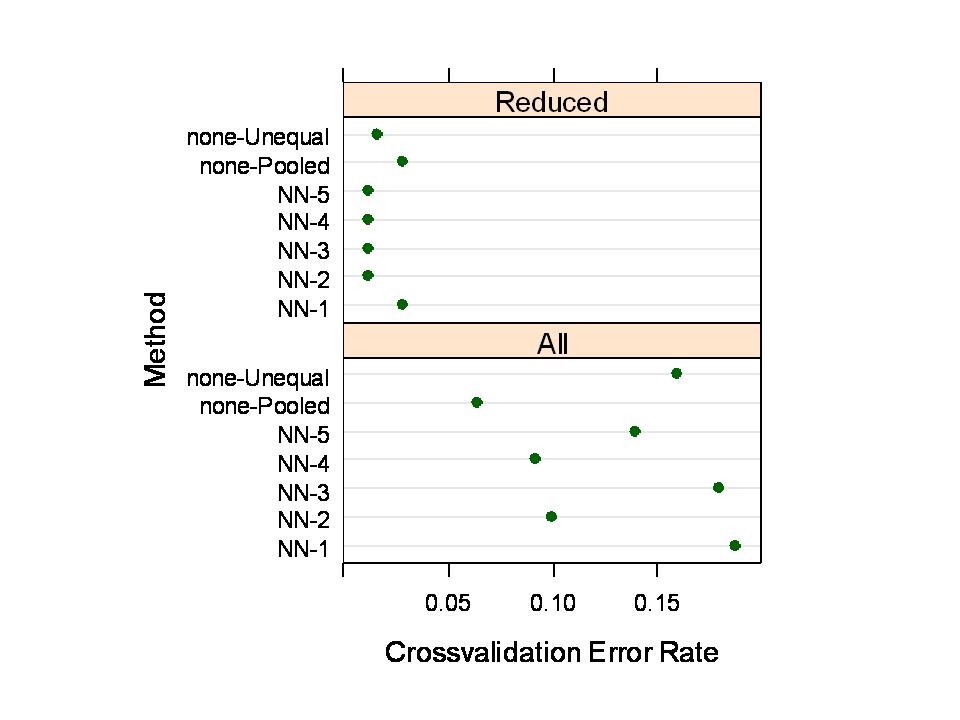
Crossvalidation Error Rate
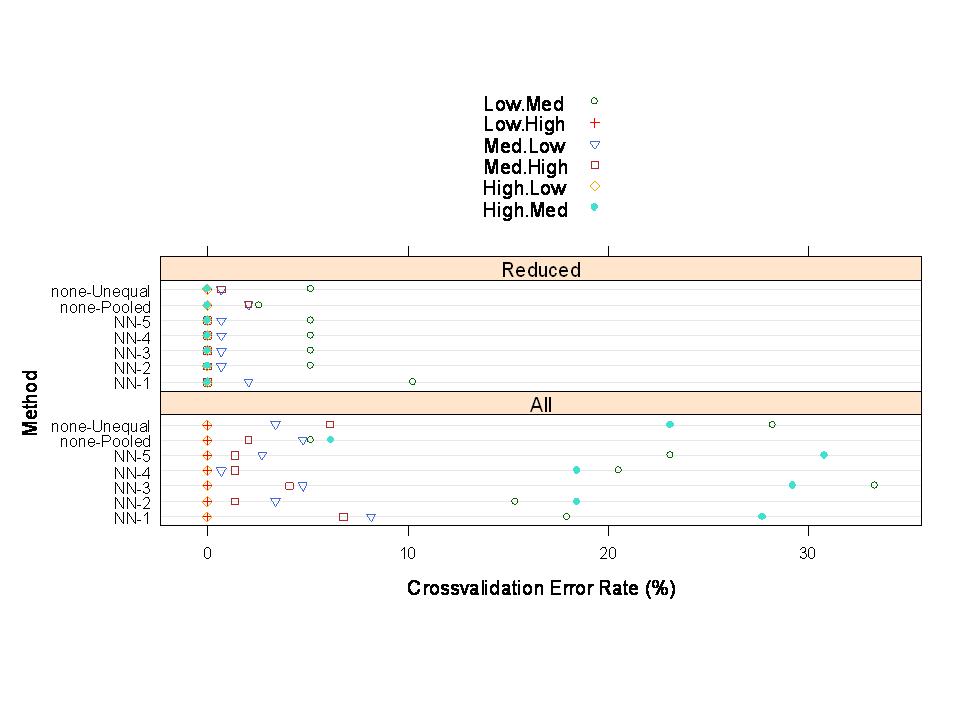
Misclassification Error Rate
Summary of Discriminant Analysis Method
Conclusions