Project 4
For this project, we are investigating a new data set. Our data consists of 25 countries with 9 different food variables including red meat, white meat, eggs, nuts, starch, cereal, fruits and vegetables, fish, and milk. We are attempting to group European countries by the amount of protein they consume from different foods. We are hoping that specific regions of Europe will be similar in this respect.
The data set can be found at
European Protein Consumption.html
**********************************************************************
Graphs and Analysis
Single Linkage
Centroid Method
K-Means Clustering
Conclusions
Back to Homepage
homepage.html
Single Linkage
Back to Top of Page
Centroid Method
Back to Top of Page
K-Means Clustering
Back to Top of Page
Conclusions
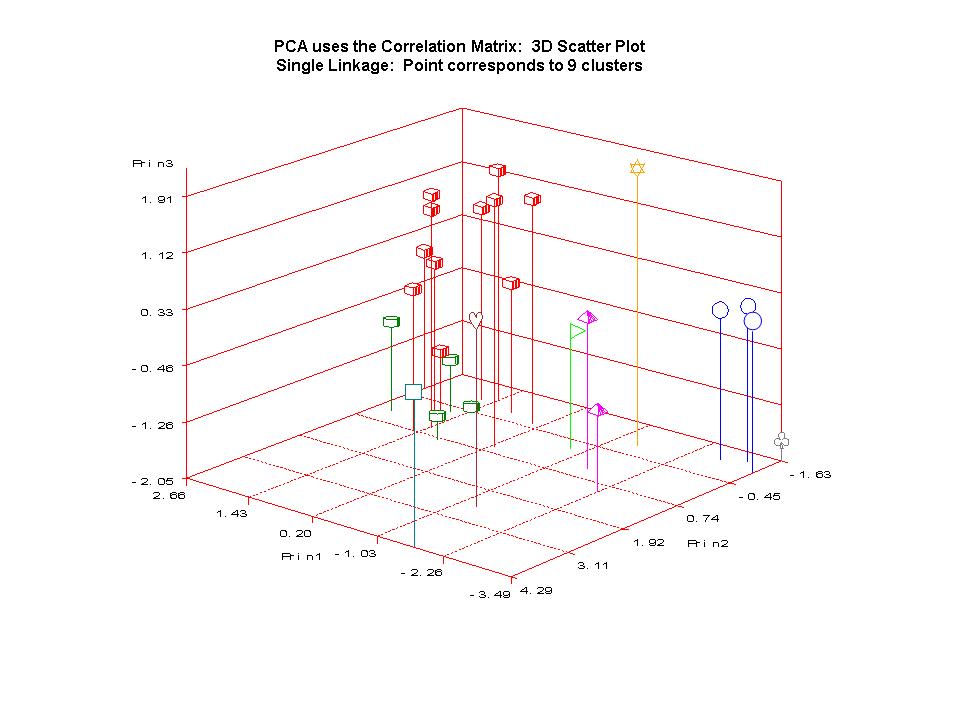
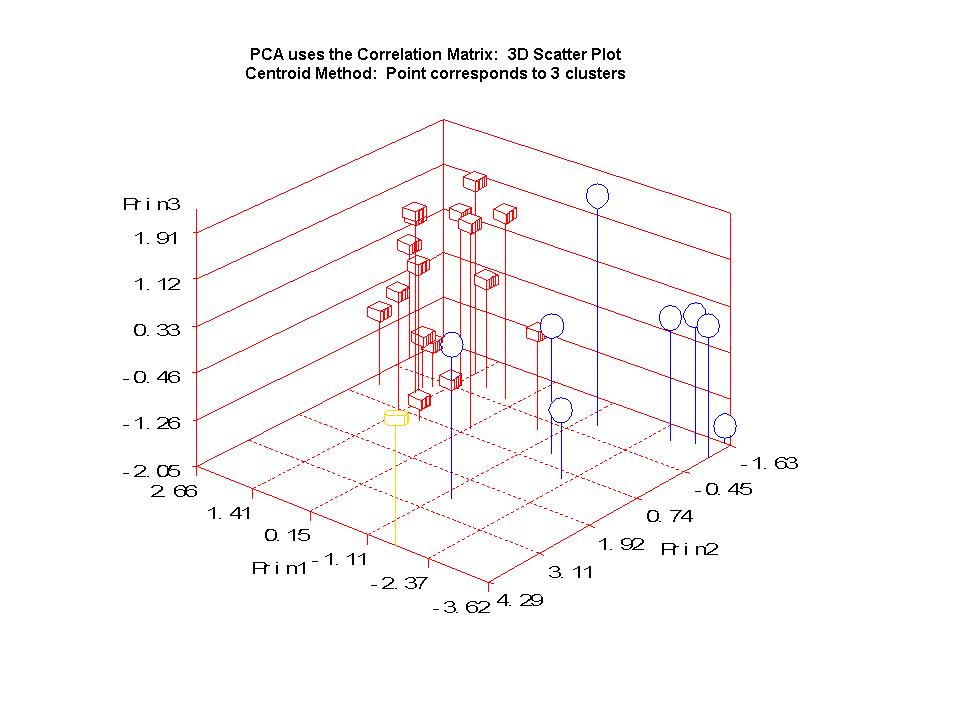
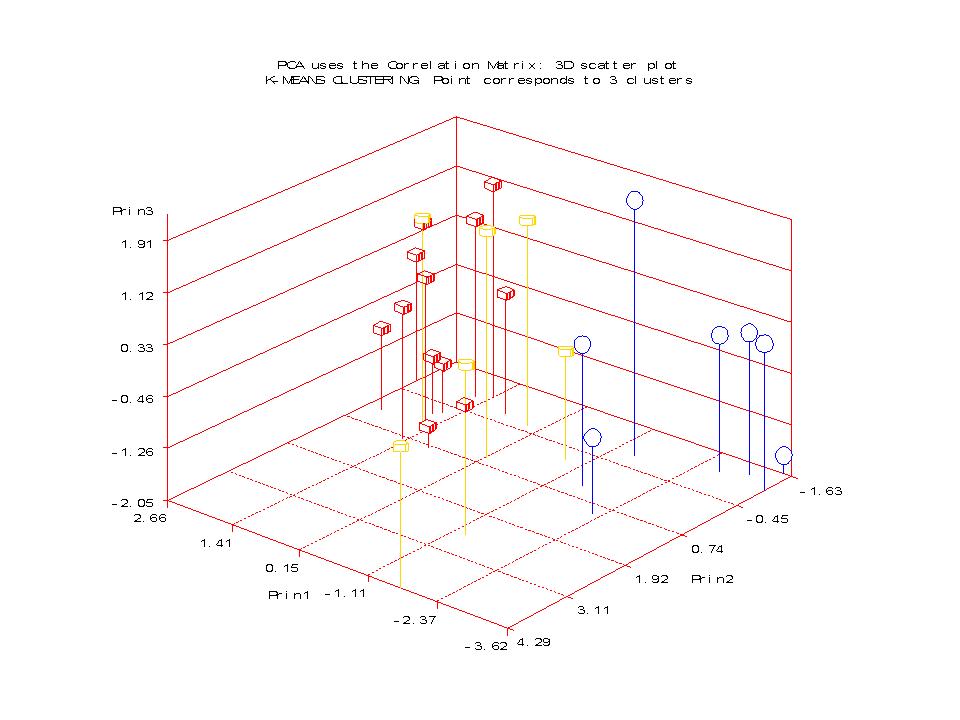
The principal component analysis showed that the data could be represented with three principal components (based on eigenvalues greater than one). Therefore, we plot the first three principal components (which explain 75% of the variation) in all 3-d plots to help us visualize how the clusters relate to one another.
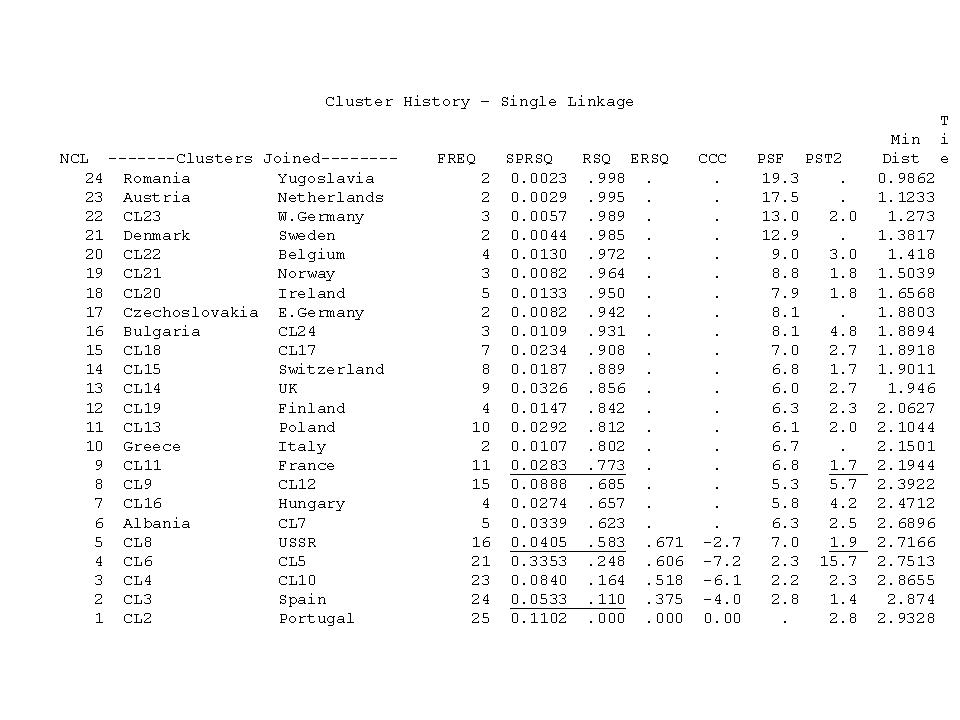
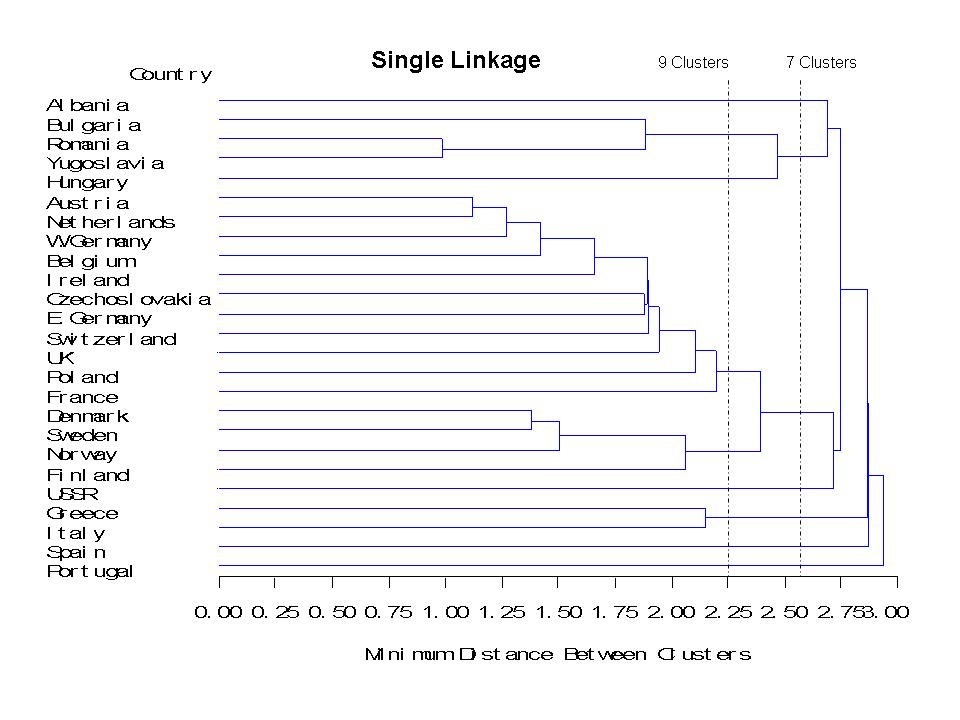
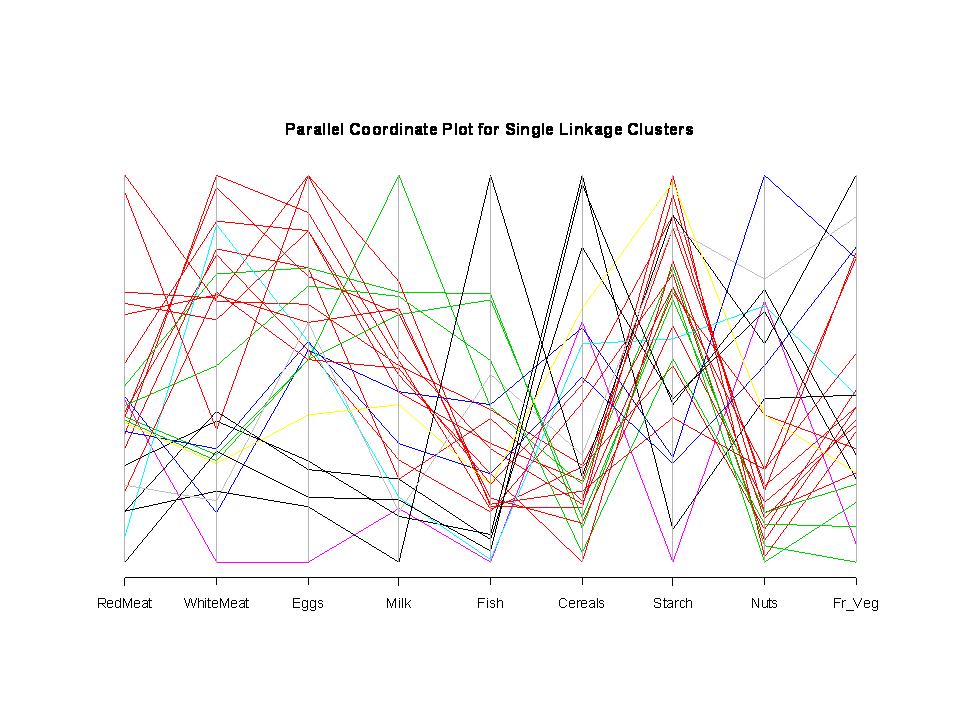
In the single linkage method our plots show nine clusters, which was determined to be the best number of cluster for this method. We made this decision by looking at the cluster history and noticing where the large changes in values occurred (denoted with a line in the cluster history) and by looking at the tree plot. In the 3-d plot, we see that five of the nine clusters are single observations, which makes us think some clusters could be combined. In the parallel coordinate plot, we can see how the clusters are similar for the different foods. For example, we see the green colored cluster (cluster 4) has countries whose inhabitants get more protein from milk and less from cereals and fruits and vegetables than citizens of other countries. This plot also shows that there could be some combining of clusters as there are single observation clusters which are similar to other clusters for at least some of the foods.
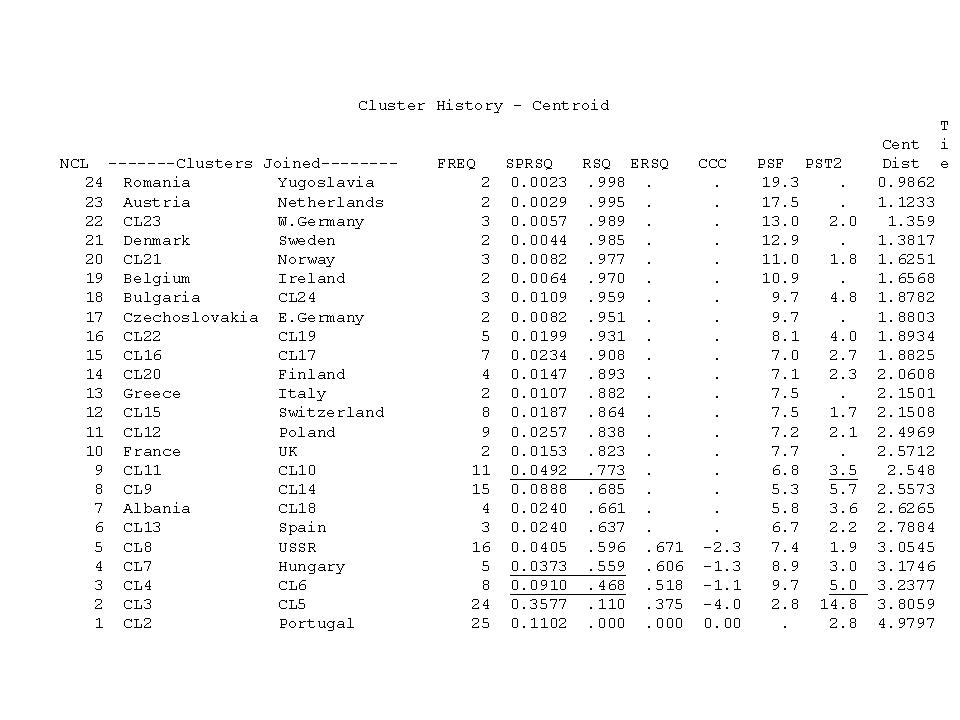
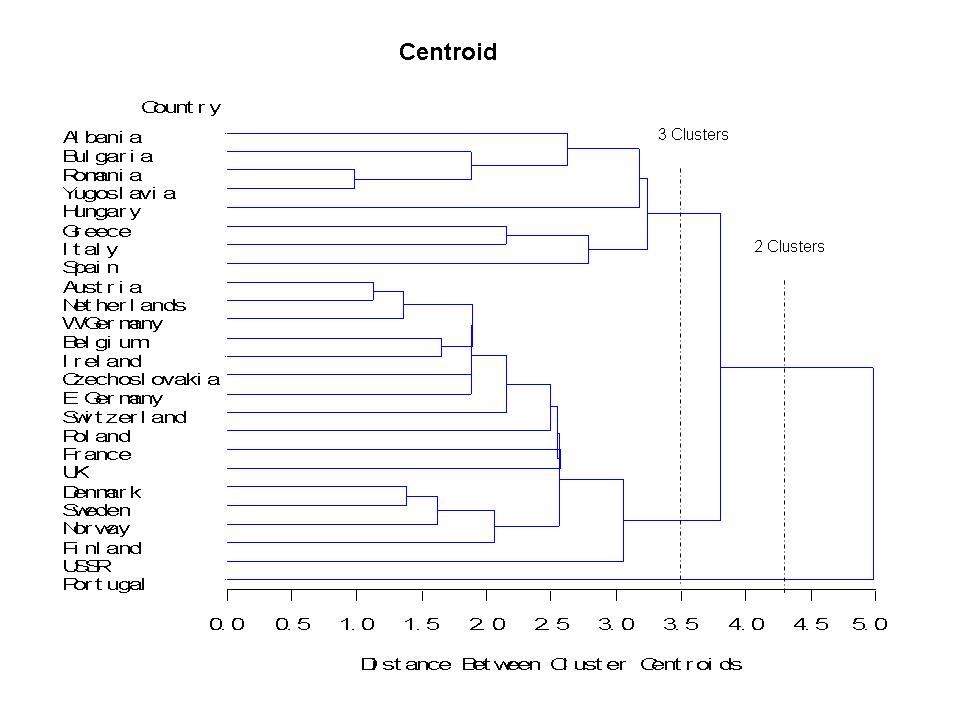
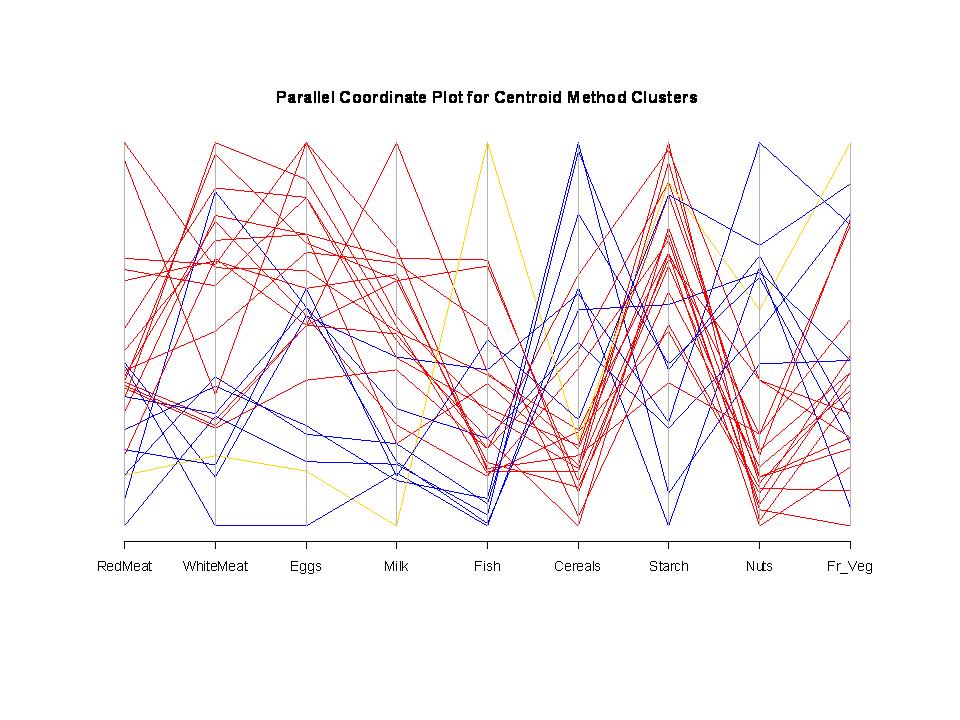
In the centroid method our plots show three clusters. These clusters were chosen in a similar manner as with the single linkage method. In the 3-d plot we see that there is one cluster with only one observation (Portugal). We can also see that this observation seems to have a high 2nd principal component value in comparison to other countries, which may explain why it is in its own cluster. For a more in-depth look at this cluster we can look at the parallel coordinate plot to see how it differs by foods. We see that Portugal seems to get a lot more protein from fish than other countries. This makes sense because Portugal is a small country which is along the ocean and has much less inland area than other countries. Three clusters seem to do a fairly good job of grouping the countries with protein consumption from similar foods.
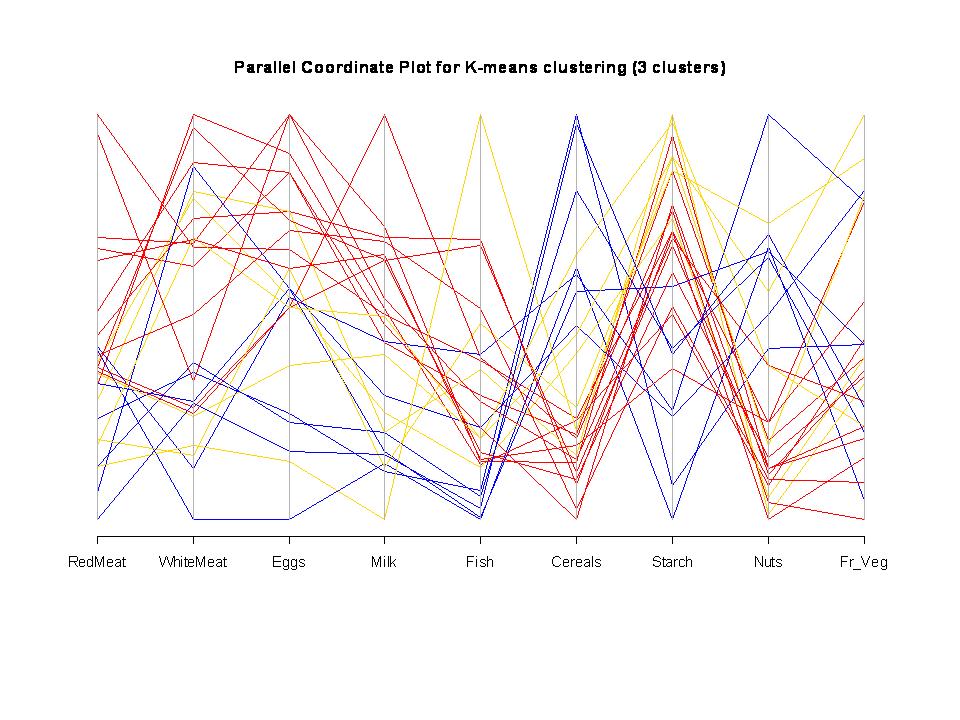
In the K-means clustering method we decided to assume that the countries could be classified into three clusters (this is based on the results of the centroid method). In the 3-d plot we see that there are some gold points which seem to be mixed with the red points, at least in terms of the first and second principal components. We see similar results in the parallel coordinate plot with a few of the gold lines (cluster 3) following the pattern of the red lines (cluster 2) meaning that some gold countries get protein from similar foods as the red countries.
WHICH IS THE BEST METHOD?
HOW MANY CLUSTERS SHOULD THERE BE?
The make-up of the clusters changes with the centroid clustering method versus the k-means clustering method with three clusters. Using the centroid method as a basis of comparison, we see that the second cluster (red in the plots) loses some countries to the third cluster (gold in the plots): Czechoslovakia, E. Germany, Poland, and USSR. The third cluster also gains Spain from the first cluster (blue in the plots).
Based on the graphs and the conclusions above, the centroid method seems to do a better job defining the clusters than the k-means clustering method and the single linkage method. The regions in which the countries are located in Europe are also more distinct in the centroid method than the k-means clustering method.
WHAT DO THESE CLUSTERS REPRESENT?
Cluster 1 contains: Albania, Bulgaria, Greece, Hungary, Italy, Romania, and Spain. With the exception of Spain, these are all countries in southeast Europe. People in these countries acquire more protein from things like cereals and nuts than people in countries from other regions.
Cluster 2 contains: Austria, Belgium, Czechoslovakia, Denmark, E. Germany, W. Germany, Finland, France, Ireland, Netherlands, Norway, Poland, Sweden, Switzerland, UK, and the USSR. This is basically the rest of Europe. People in these countries acquire more protein from things like red meat, white meat, eggs, milk, and starches than people in countries from other regions.
Cluster 3 contains Portugal which is on the southwest edge of the continent. It may have unique attributes when compared to its neighboring country, Spain, because of its comparatively small size. People in Portugal acquire more protein from things like fish (which makes it unique), starches, fruits, and vegetables than people in countries from other regions.
Back to Top of Page
Back to Homepage
homepage.html.