 The ship motion and tilt can have additional effect on the people.
Jayanta Majumder*, Dracos Vassalos*, Luis GuarinU, Guro C. VassalosU * Department of Naval Architecture and Marine Engineering, Universities of Glasgow and Strathclyde, United Kingdom; U Safety at Sea Ltd., Glasgow, United Kingdom
Simulation can greatly aid the design of the shipboard layout and safety provisions. The operations and scenarios related to safety can be evaluated through simulation and thus various design alternatives can be compared. We have developed a software system, named Helios, to that end. The core of the system is a powerful spatial database upon which several types of simulated objects act and interact. The spatial database represents the geometry and topology of the entire ship comprising its hull and subdivisions. Numerical models (or simulated instances) of various aspects of shipboard operations are built around the spatial database and can be controlled visually. The numerical models built and integrated into the system so far, include that of crowd flow, vehicle loading, fire/smoke spread, spatial coverage and hydrostatics. This paper focuses on a very important facet of this system, viz. a processing pipeline that prepares the spatial database from the available general arrangement drawings.
This pipeline performs recognition of graphics in the 2D drawings and generation of a topologically informed model of the 3D environment, which is aware of the spatial location of each entity of interest and allows easy computation of routes and connections. This data pipeline comprises several stages of processing and involves interesting ideas from computational geometry. Usually simulation tools make the user model its input data from scratch, which is a burdensome task. This processing pipeline, which generates the simulation environment from existing drawings, relieves the user of this burden.
This paper will present the computational problems arising in this pursuit and also the solution algorithms and strategies adopted thereupon.
Planning and design processes greatly benefit from mathematical modelling, since a faithful model of the real thing helps analyzing and evaluating the details of several conceived design alternatives. The aspects of ship performance that have been most commonly addressed through mathematical modelling are intact stability, manoeuvrability, damage stability, resistance etc. these being important to the day-to-day aspects of maritime activity. But as human civilization moves on to a greater level of development and prosperity, and also with the phenomenal development of computational technology, it becomes worthwhile and possible to formulate broader models of ship performance, broad enough to subsume rich behavioural models of humans onboard. Computer based modelling and simulation of people onboard the ship opens up many new opportunities of investigation. Most importantly, it allows evaluation of the performance of a ship's layout with respect to ease of evacuation and emergency mustering. It also allows assessment of risk to life in shipboard hazards involving people.
Crowd-flow modelling has been an active area of study for a long time, especially in urban planning and design, and has resulted in a number of theories, methods and systems [2,3,4,5,6,7,8,9,10,14, 17, 18].
There has been some statutory guidelines about managing civic crowd scenarios, as laid out by various governments for quite some time, for example [11,12,13] are the ones published by the British government. More recently the concern has reached the maritime sector. A recent statutory requirement that every new Ro-Ro passenger ship must be evaluated for evacuation performance, has generated new waves of interest in crowd dynamics in the maritime sector. In response to this requirement, several corporations and research organizations have come up with their own method and software for modelling evacuation. Our software tool presented here, viz. HELIOS, (an acronym for Human Environment Local Interactions Onboard Ships) was developed primarily to serve this regulation, but it has been designed to be a platform for integration of various simulation models relevant to shipboard operations.
Modelling of shipboard occupants is not much different from modelling of crowds in buildings, by and large it is a sound assumption that behavioural model of people onboard ships is no different from that in, let's say, a hotel building of similar size. However there are two aspects in which the shipboard emergency departs from a civic building scenario.
The ship motion and tilt can have additional effect on the people.
The usual command to the occupants in case of a shipboard emergency is not as simple as desert the compound. It usually involves dynamically decided mustering based on the location and nature of the emergency.
Microscopic simulation is a more reasonable model for crowd dynamics because it can capture the complex behaviour of a crowd as an emergent product of actions of its individual members. This fact is well understood and as a result most of the models in the literature are microscopic. In a microscopic model it becomes possible to incorporate the effects of most aspects of the simulated situation (tilt, motion, smoke, heat, darkness etc.) in the form of accumulated, local and instantaneous effects on the people. This is why we planned for Helios to grow and subsume simulation models of many aspects of the shipboard emergency environment. A problem central to this development was to define a model of shipboard geometry and connectivity that could form a basis for these simulation models. Here we shall briefly touch upon most of the features of Helios but will focus on the definition and generation of this environment model. See [1] for a description of the aspects of human behaviour modelling in Helios.
Helios was developed to help in the problems of shipboard operations planning and layout design. The first problem to arise in its pursuit was to define a faithful representation of the shipboard environment.
A 3D virtual reality drawing of a ship may be a good visual representation but its disadvantage is that it is nothing more than a set of nicely drawn graphic primitives - like polygons, splines and lines with no notion of design intent associated with them. In order for the environment model to be amenable to simulation, it must have some sort of meaning associated with geometric entities. The model must lend itself to annotation with relevant information, for example, it should be possible to mark a region and give it a name and later refer to it by that name. It should be possible to mark a point in the environment and enquire about the occupancy or volume or material composition of the compartment that contains the point.
The entire environment is a large entity, and the occupants (people, cars etc.) are much smaller. The locality of each occupant is a small part of the entire ship, yet these small parts must be bound together by some topological relationship so that a plan to go from one location of the ship to another may be seen as a long sequence of small transitions from one small locality to another.
It should also be possible to distribute values over parts or whole of the environment, for example, the data from a fire/smoke transport simulation program (e.g. CO, CO2, O2, toxicity etc distributions) should be possible to associate with the environment model in such a way that the local and instantaneous value can be made to affect the occupants.
Another aspect of the requirements of an environment model comes from the fact that the existing data of shipboard layout comes in the form of line drawings, also known as general arrangement drawings (abbreviated as GA). This does convey the information in a human interpretable form, but it is not directly usable as a representation of the topology of the ship. The line drawing is merely a set of lines, splines and arcs. What we need in our computational representation are the geometry, connectivity and (when applicable) the semantics of sub-regions of the shipboard environment. Semantic information may be included manually into the drawing in the form of special graphical symbols, but the process of creation of the environment model should be largely mechanized. The environment model should have a visual representation that looks like the actual ship. The display of simulation and the user interactions should be done through the visual model. With the aforementioned requirements defined for the Helios environment model, the ideal solution appears to be a spatial database supporting object localization and local annotation.
The spatial database of Helios is really a data structure representing the shipboard layout and supporting efficient computation of queries like point-localization, range-searching etc. It is a 2-manifold composed of triangular faces. In this section we describe its generation process. Two instances of similar work have been reported in the literature [23, 24] but the assumptions they make about the floor plans (e.g. special conventions about layer naming etc.) were not valid for the shipboard GA drawings that we are concerned with. In the generation process the GA drawing goes through a processing pipeline as shown in figure 1.
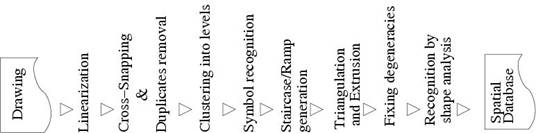
Figure 1: The processing pipeline used in preparing the spatial data from general arrangement drawings
Figure 2(A) shows a sample GA drawing. The GA drawing is a piece of 2D vector graphics in DXF format [22] consisting of line segments and algebraic curves like arcs, circles and splines. The first stage in the processing pipeline involves replacing the algebraic curves by piecewise linear approximations, after this is done, the GA data is a set of line segments. We call this stage linearization.
The next stage is that of cross snapping and removal of coincident line segments. Cross snapping involves merging of end-points that are close enough (this is done efficiently by successive insertion of end points in a BSP tree [16]).
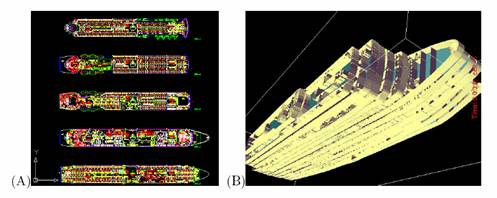
Figure 2: (A) A general arrangement drawing and (B) A 3D spatial database generated from it
At this stage the data still is a large set of line segments. The many decks in the GA are laid out in separate regions of the drawing. However, till this point of processing there is no explicit information on which groups of line segments belong to the same deck. Clustering the line segments generates this information. Algorithm 1 (figure 3) presents the clustering method.
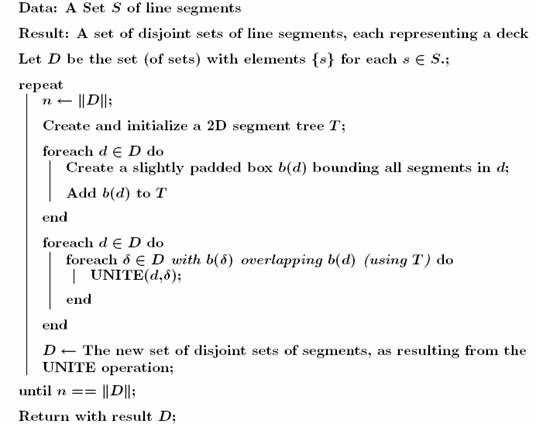
Figure 3: Algorithm 1: Algorithm for clustering line segments into decks
In algorithm 1, the set of disjoint sets of segments is maintained using the UNION/FIND algorithm with path compression (see Chapter 22 of [15]), and the UNITE operation is that of a standard disjoint set union. Reference [16] describes segment trees in detail.
After this processing is complete we get groups of line segments each belonging to one deck. As regards ordering the decks, we use a convention. Usually the decks in the GA drawing are laid out in ascending order of height from bottom to top. If this is not the case in a GA, this has to be manually done.
The next stage is that of extraction of symbols. The symbols are added to the GA drawing to convey information about the layout. Different symbols have different meanings; the location and pose of the symbols are determined and appended to the data passing through the processing pipeline. For example, a very important symbol is ![]() (cross pattee) which associates a reference point or origin of coordinate system with each deck. The clustering of line segments into decks does not tell how the decks are aligned together. The reference point associated with each deck tells that the decks are to be so aligned that the reference points fall on the same vertical line in 3D. The symbols are themselves simple drawing objects or entities available to the user as a library and are meant to be copied and pasted (using AutoCAD etc.) at appropriate locations in the drawing to convey some information. The recognition of the symbols is done using the affine invariant matching, in which the symbol is compared with parts of the drawing in a way that is independent of scale, translation, rotation and mirror flipping (described in algorithm 2, figure 4).
(cross pattee) which associates a reference point or origin of coordinate system with each deck. The clustering of line segments into decks does not tell how the decks are aligned together. The reference point associated with each deck tells that the decks are to be so aligned that the reference points fall on the same vertical line in 3D. The symbols are themselves simple drawing objects or entities available to the user as a library and are meant to be copied and pasted (using AutoCAD etc.) at appropriate locations in the drawing to convey some information. The recognition of the symbols is done using the affine invariant matching, in which the symbol is compared with parts of the drawing in a way that is independent of scale, translation, rotation and mirror flipping (described in algorithm 2, figure 4).
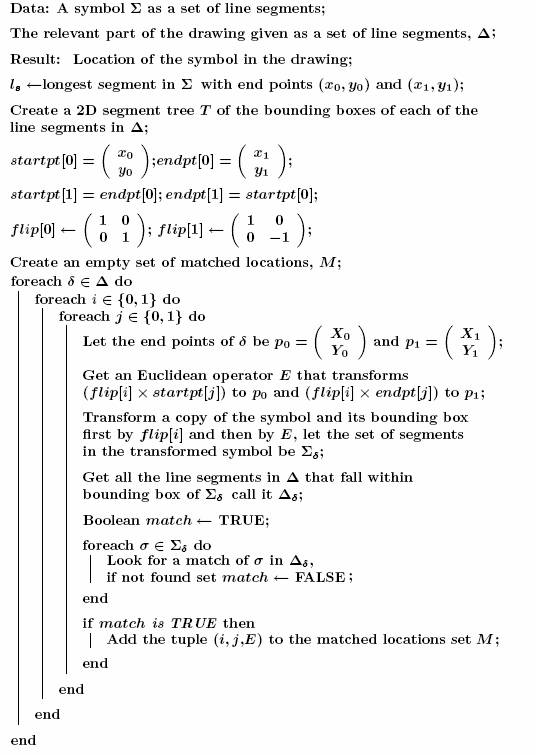
Figure 4: Algorithm 2: Algorithm for location of symbols in the drawing
In algorithm 2, the step "Get an Euclidean operator E..." may be expanded into the following.
The operator E is of the form  , which is required to transform two points (xa,ya) and (xb,yb) to (Xa,Ya) and (Xb,Yb) respectively by rotation, isotropic scaling and translation. This leads to the matrix equations
  and
and  , which consists of fours independent scalar equations that can be solved to determine the elements of E.
The symbols are restricted to specially designated layers, so that the line segments belonging to only those layers are considered in the location of symbols. This reduces the computational cost incurred in the process.
The next stage in the processing pipeline reconstructs the geometry of staircases in the environment. A general arrangement drawing or a building floor plan is the plan view of the layout, and the plan view does not contain the aspects of the geometry that would appear on a lateral projection. This entails that much of the description of a staircase or a ramp between two levels is absent in a single planar projection. To reconstruct this information, instead of seeking what the geometry actually is, we would find out what the best geometry should be, and hope that the designer must have designed it reasonably close to the best geometry. To do it we must formulate as to what constitutes the quality of a staircase or ramp. One could come up with a number of factors but a fairly reasonable and simple answer is that - the lesser steep the better it is, given that we have no control over how narrow or wide it should be, as this information comes from the drawing directly. In technical terms, this means that if we minimize an aggregated value of steepness of the staircase, it should lead to a reasonable reconstruction. We optimize steepness functional over the projected domain of the staircase using the finite element method. If the vertical coordinate over the projected domain of the staircase or ramp is given as a function z(x,y), we use the steepness functional ![]() . The integrand is the square of the greatest slope at a point (x, y), and an area weighted sum of such local greatest slopes is what we minimize using the Ritz method [25]. We avoid providing a detailed description of the procedure in this paper due to space constraints, but a brief sketch follows.
. The integrand is the square of the greatest slope at a point (x, y), and an area weighted sum of such local greatest slopes is what we minimize using the Ritz method [25]. We avoid providing a detailed description of the procedure in this paper due to space constraints, but a brief sketch follows.
We generate a mesh over the domain and describe the distribution of z over the projected domain as a function of individual z values at the mesh nodes, and make a discretized formulation of the steepness functional. For the value of the functional to be minimum, the derivatives of discretized steepness with respect to z values at mesh nodes must vanish. Some z values (where the stair-sheet meets the flat levels) provide additional equations, similar to boundary conditions in physical problems.
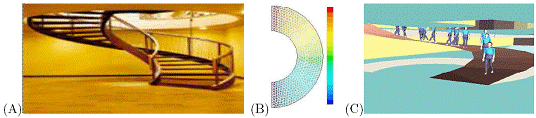
Figure 5: Generation of a Spiral Staircase
Figure 5 illustrates the generation of the geometry of a spiral staircase; in particular figure 5(B) shows a mesh over which the z function is shown by a colour scale. Figure 6 shows two more examples of reconstructions made using the variational method described above. Quantizing the surface at iso-z contours can generate staircase steps, but we have left that out for a later release of Helios.
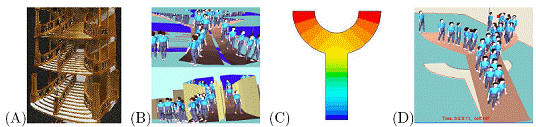
Figure 6: Generation of complex staircases
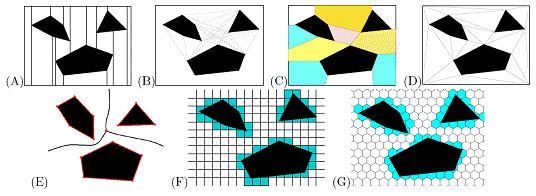
Figure 7: Some network and partition schemes for location and navigation in the presence of three obstacles, shown as solid black polygons.
The data at this stage of processing represents a building or ship with multiple horizontally laid out levels but the internals of each level consist merely of line segments (standing for walls and boundaries of obstacles), there is no information on localized regions or any connectivity thereof.
The whole environment needs to be seen as a connected network of small sub-regions, primarily for the purpose of route planning and reasoning about the space. There are several ways of getting a topological structure suitable for route planning from a set of line segments and polygons. Vertex visibility graph (fig 7(B)), trapezoidal map (fig 7(A)), Voronoi diagram (fig 7(E)), convex connectivity graph (fig 7(C)), structured grid-cell graph (fig 7(F) and 7(G)) and constrained triangulation (fig 7(D)) are to name a few. A discourse on these methods and their properties is present in [16]. The structured grid cell approach (Fig. 7(F) and Fig. 7(G)), although quite common in evacuation models [17, 18], is used in conjunction with quantization of positions and directions thereby making a big compromise. It causes anisotropy (i.e. difference in displacement and speed along different directions) of motion in simulated objects, leading to an inherent error margin of up to 41.4%. Among the remaining options, we chose constrained triangulation for Helios because it enables efficient solution to three most important problems relevant to our simulation models - (a) route planning (b) point location and (c) visibility predicate.
This stage of processing computes what is called a Constrained Delaunay Triangulation [21] of the line segments on each level. This essentially is a partition of each deck into triangular pieces of floor space such that the original line segments only form some of the sides of the triangles and not intrude the interior of any of them. The triangles on the floor area of figure 11(right) show an example of such a partition.
The extrusion stage, which immediately follows triangulation, is merely the act of assigning a height value to each of the walls. Constrained triangulation of an arbitrary set of lines can lead to degenerate triangles that need to be excluded for the sake of robustness and correctness of subsequent computations. Here degeneracies are overly skinny triangles that topologically represent a connection but geometrically the connection is infeasible. Figure 8 (with bold lines being walls and dashed lines being open sides), the triangle ABC illustrates a class of degeneracy that appears in a constrained Delaunay triangulation. However all skinny triangles are not topologically degenerate as they may as well represent a significant connection, the triangle PQR in figure 8 is an example. As degeneracies are excluded new degeneracies become detectable. This fact makes this step an iterative one.
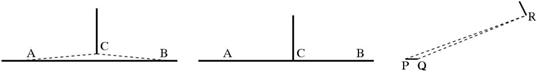
Figure 8: Illustrating degeneracy of triangles
The environment model so generated is ready as a spatial database to support annotation and simulation. However, a few more operations are supported for recognizing shapes of regions. Regions have shapes and shapes have certain signatures that help grouping similar shaped regions together. This is done by statistical clustering in the feature space of the shape/size signatures.
The spatial database of Helios supports the queries and operators needed by applications that have objects requiring localization, local annotation, and geometry based calculations. It serves as a support framework, and eases development of applications around it. We have developed few such applications and are in the process of developing more of them. The foremost application of the Helios framework is the evacuation simulation module, which has been successfully used in simulation of mustering onboard ferries and cruise ships.
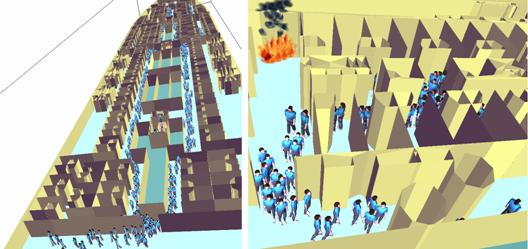
Figure 9: Glimpses of Helios (the right frame shows flame and smoke)
Another of the applications of Helios is an input model generator for a fire/smoke transport simulator called Raeume, developed in our organization [20]. The input model requires information on compartments, their connectivity, material composition, ventilation details, fire location etc.
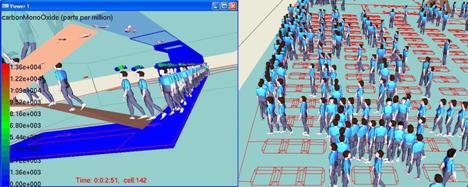
Figure 10: Simulations in Helios: (left) evacuating through smoke (right) evacuating an auditorium, chairs displayed as planar projection for better visualization.
This involved addition of some space annotation functions into Helios. The output of Raeume can be imported into Helios to give rise to the capability of simulating complex scenarios of evacuation in conjunction with fire/smoke spread. A study of this capability has been described in [19], and fig. 10(left) shows its screenshot.
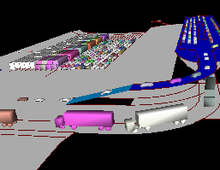
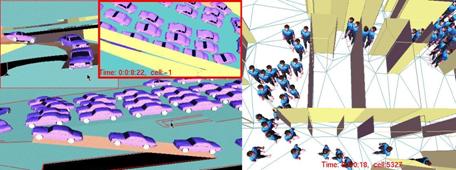
Figure 11: (left) Loading of cars into a ferry (right) Displaying the floor triangulation
We wrote another application of simulating loading of vehicles into ships. It is a simple extension in which users can create vehicles at any location in the environment, then specify their paths and speeds and watch them follow their paths. Figure 11 (left) shows a screenshot of this feature. Frivolous as it may seem, this application can be useful in designing facilities for loading and unloading of cars in ferries. It has actually been used in an undergraduate dissertation in our university to study design alternatives for the Ardrossan car ferry terminal, Scotland.
An application on hydrostatics calculation has been developed that uses the geometric data subsumed by Helios. It consists of a module that imports the hull and the subdivisions exported by programs like NAPA. The essence of its working involves calculation of sectional properties from the hull and computation of volumes of the compartments. The former is done by an added functionality and the later was ordinarily supported by the geometric data structures in Helios. The program also provides the option of using NAPA in background to perform the hydrostatic calculations. A case based reasoning program has been plugged into this setup, which makes counter-flooding suggestions when a flooding scenario is presented to it. This case based reasoning program was developed as a deliverable to a European Union funded project titled COMAND. Figure 12 shows some screenshots of the counter-flooding advice function developed using Helios. This feature of Helios makes it useful as an onboard ballasting analysis program.
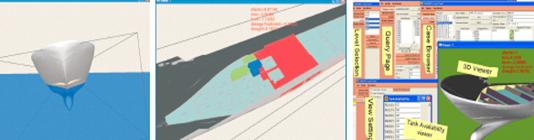
Figure 12: The hydrostatics functions of Helios.
Visibility coverage analysis is yet another interesting feature developed in Helios. It is defined as the extent or part of the environment that can be swept by a straight ray rotating about a point that is obstructed by an obstacle. Intuitively, it is the area that can be guarded by a person standing at a point but free to look around. We have defined variants like distance (or angle) limited visibility, in which the region beyond a specified distance (or angle) is considered invisible. We can also have both angle and distance limited visibility coverage.
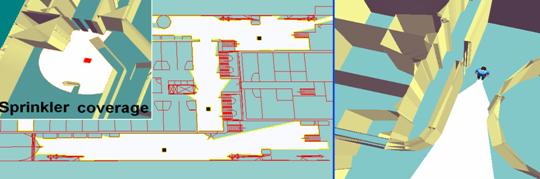
Figure 13: Visibility Coverage
Another interesting form of visibility coverage is locus visibility coverage, which is the region that would be under surveillance as a guard goes along a specified path. All these forms of visibility coverage can be evaluated using Helios. This feature is thought to be useful the following tasks:
Identifying optimum location of guiding signs, TV screens, sprinklers etc., also evaluating and ranking positions of commercial adverts.
Deciding positions of guards, crew, and surveillance cameras.
Analyse the positioning of emergency signs for scenarios with smoke, in which maximum visible distance significantly reduced.
Design of deck-plans with the objective of its amenability to surveillance with minimum resource.
Figure 13 shows some screenshots of this function.
Several accidents have been caused or aggravated due to absence, incompleteness or inaccuracy of information available about the scenario. Distributed ubiquitous monitoring with sensor networks is slowly but surely catching on as a viable measure for ensuring availability and reliability of situational information. With modern technology of tiny and inexpensive processor-cum-transponder units (sometimes referred to as smart dust), it is possible to set up a pervasive monitoring system that keeps track an indoor or outdoor environment with a very fine granularity and high reliability [26,27,28]. The overall setup of such system requires a spatial database support for associating sensed data with spatial semantics. A spatial database similar to Helios would be inevitably required in organizing the sensed data and for automated reasoning about the sensed environment. Helios may be used as a front end to such applications.
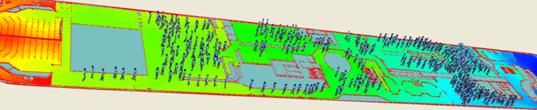
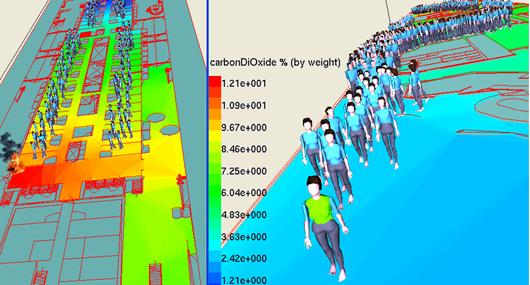
Figure 14: Visualization of spatial distribution of monitored data.
The geometry savvy spatial database of Helios already supports several classes of queries that we envision as useful to sensor fusion scenarios, more shall be developed as we investigate further along these lines. As an example of application, in an aggravated scenario it would be quite useful for command and control personnel to be able to visualize the spatial distribution of people in conjunction with the data monitored in real time, (as shown in figure 14) and query the system about safe routes.
A well-designed framework should significantly relieve the burden of work from the class of activity it caters to. Our Helios effort seems to be heading correctly in that direction. We shall continue to add value to the framework and hopefully it will become a more efficacious tool in near future.
References
1. Majumder J, Vassalos D. et. al., Modelling and Simulation of Shipboard Environment and Operations, COMPIT conference, May 2005, Hamburg
2. Ulicny B., Thalmann D., Crowd simulation for interactive virtual environments and VR training systems Proc. Eurographics Workshop on Animation and Simulation 2001
3. A Survey of Evacuation and Fire Models http://www.firemodelsurvey.com/EgressModels.html
4. Thalmann D., Ulicny B., Towards Interactive Real-Time Crowd Behaviour Simulation Computer Graphics Forum 2002 21:4 p. 767
5. Drager K.H. , Loevas G.G., Wiklund J., EVACSIM - A Comprehensive Evacuation Simulation Tool Proc. 1992 Int. Emergency Management and Engineering Conference
6. Klupfel H., Mayer-Konig T., Wahle J., Schreckenberg. M., Microscopic simulation of evacuation processes on passenger ships Proceedings of the Fourth International Conference on Cellular Automata for Research and Industry: Theoretical and Practical Issues on Cellular Automata Pages: 63-71 Year of Publication: 2000
7. Still G. K., Crowd Dynamics, PhD thesis, Warwick University, 2000.
8. Thompson P.A, Marchant E.W., A Computer-model for the Evacuation of Large Building Population, Fire Safety Journal, 24(2): 131-148, 1995.
9. Varnar D., et. al., UMSC Small Unit Leader Non-Lethal Trainer, in Proc. ITEC'98, 1998.
10. Williams J.R., A Simulation Environment to Support Training for Large Scale Command and Control Tasks, PhD thesis, University of Leeds, 1995
11. Guide to Safety at Sports Grounds. HMSO London. 1997 (ISBN 0113000952)
12. The Event Safety Guide. A Guide to Health, Safety and Welfare at Pop Concerts and similar Events HMSO London. 1999. (ISBN 0113410727)
13. Guide to fire precautions in existing places of entertainment and like premises. HMSO London. 1998 (ISBN 0113409079)
14. Fruin J., Pedestrian and Planning Design. Metropolitan Association of Urban Designers and Environmental Planners.1971. Library of Congress catalogue number 70-159312 (Elevator World Inc. Educational Services Division. PO Box 6507, 354 Morgan Avenue, Mobile, Alabama 36606)
15. Cormen T. H., Leiserson C., Rivest R. L Introduction to Algorithms, The MIT Press, 1990
16. Berg M. De, Kreveld M. Van, Overmars M. , Schwarzkopf O., Computational Geometry, Second Edition, Springer-Verlag, 2000
17. Gwynne S., Galea E., A systematic comparison of model predictions produced by the buildingEXODUS evacuation model and the Tsukuba evacuation data, Journal of Applied Fire Science, 7(3), 235-266, 1997-98
18. Ketchell N.,A technical summary of the AEA EGRESS code, AEA Technology document ref. AEAT/NOIL/27812001/002(R) Issue 1
19. Guarin L., Majumder J., Shigunov V., et. al. Fire and Flooding Risk Assessment in Ship Design for Ease of Evacuation International Conference on Design for Safety, Oct 2004, Osaka, Japan
20. Shigunov, V., Fire development and smoke propagation in ship compartments, Ship Technology Research - Schiffstechnik 51(1) 9-20,2004
21. Chew P., Constrained delaunay triangulations Symposium on Computational Geometry, pages 215-222, 1987.
22. Autodesk Inc. AutoCAD 2000 dxf reference http://www.autodesk.com/techpubs/autocad/acad2000/dxf/
23. Lewis R., Generating Three-Dimensional Building Models from Two-Dimensional Architectural Plans. Master's thesis, Computer Science Division, UC Berkeley, May 1996.
24. Zhi G.S., Lo S.M., Fang Z., A graph-based algorithm for extracting units and loops from architectural floor plans for a building evacuation model Computer Aided Design 35(2003) 1-14
25. Farlow S. J., Partial Differential Equations for Scientists and Engineers, Dover publications, Reprint edition (September 1, 1993)
26. Seth Edward-Austin Hollar, COTS Dust, MS Thesis, University of California, Berkeley, Mechanical Engineering (http://www-bsac.eecs.berkeley.edu/archive/users/hollar-seth/publications/cotsdust.pdf)
27. G. Pottie and W. Kaiser, Wireless Integrated Network Sensors, Communications of the ACM, 43 (5): 51-58, May 2000.
28. J. M. Kahn, R. H. Katz, and K. S. J. Pister, Next Century Challenges: Mobile Networking for Smart Dust. ACM MobiCom 1999, pp. 271-278.