I compared my estimate to the NCDC Data.
also a list of stations used
then I multiplied the anomalies by the cosine of the latitude.
| I created a estimate of the tempature of the lower 48 for the month of january from 1950 to 2006 to test how "saturated" the ushsn is. I compared my estimate to the NCDC Data. |
|||||||||||||
| results in text also a list of stations used |
in my analysis I averaged two 5 by 5 degree rows. one the south was around 35 degrees latitude the other was at 45. then I multiplied the anomalies by the cosine of the latitude. |
||||||||||||
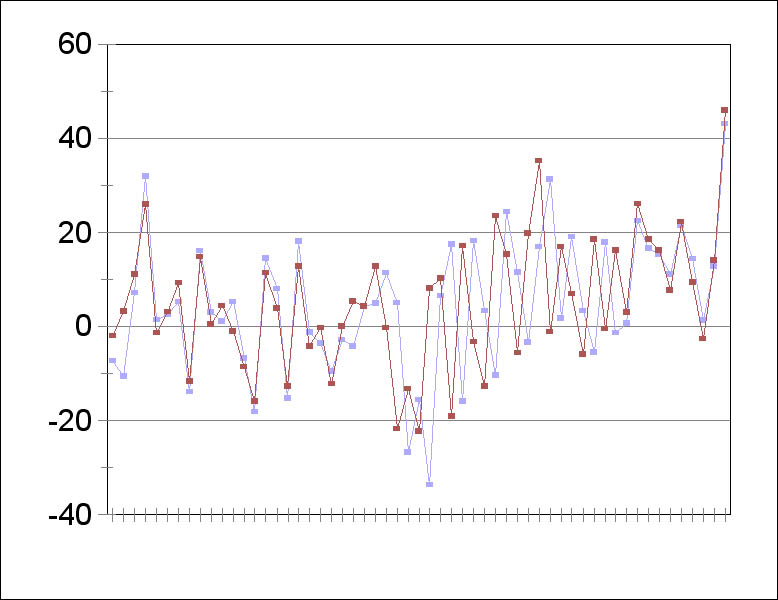
| my estimate is in blue,ncdc is red | |||||||||||||
| one year |
|||||||||||||
|
|||||||||||||
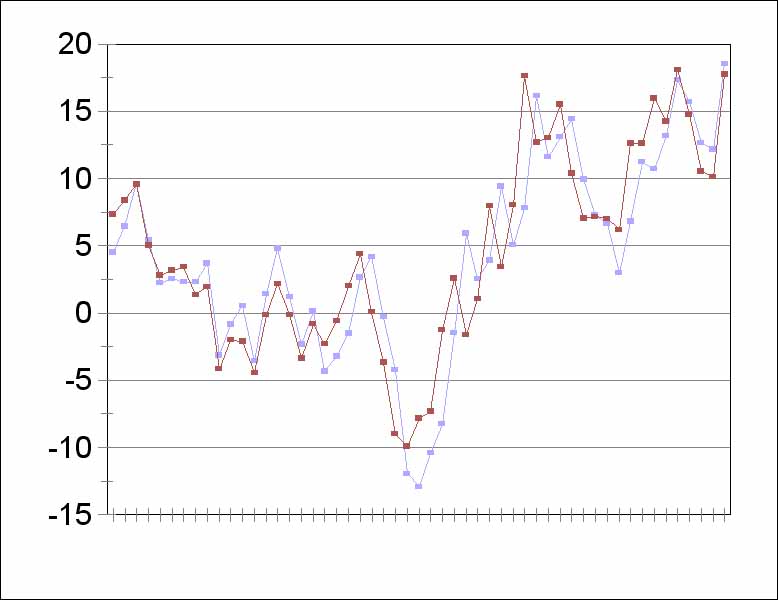
| 5 year | |||||||||||||
|
|||||||||||||