x < - 1.3
x > 0
Function is decreasing for:
- 1.3 < x < 0
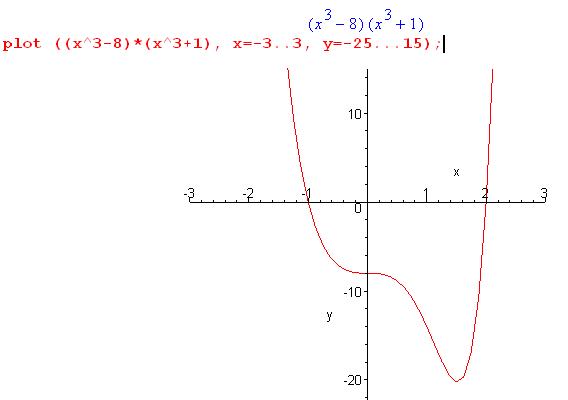
Increasing and decreasing functions:
| Function is increasing for: x < - 1.3 x > 0
Function is decreasing for: - 1.3 < x < 0
|
|
Increasing functions in the interval of x1 and x2:
x1 < x2
f (x1) < f (x2) (by using the function)
f’ (x) > 0 (by using first derivative)
Decreasing functions in the interval of x1 and x2:
x1 < x2
f (x1) > f (x2) (by using the function)
f’ (x) < 0 (by using first derivative)
Critical number:
c is a critical number if
f’(c) = 0 or
f’(c) does not exist (undefined).
Critical point:
Critical Point: (c, f (c))
First derivative test:
Let f’(c) = 0 and c: critical number
Local maximum at c if f’(x) changes sign from positive to negative at x = c.
Local minimum at c if f’ (x) changes sign from negative to positive at x = c.
Neither local maximum nor a local minimum if f’ (x) does not change sign at x = c.
Second derivative test:
Local maximum at c if f’(c) = 0 and f" (x) < 0
Local minimum at c if f’(c) = 0 and f" (x) > 0
Three ways of finding local maximum and local minimum:
| local maximum | local minimum | |
|
the original function |
f(c) > f (x) for all x values near c (on both sides of c). |
f(c) < f (x) for all x values near c (on both sides of c). |
| First derivative test |
f’(c) = 0 and f’(x) changes sign from positive to negative at x = c
Neither local maximum nor a local minimum if f’ (x) does not change sign at x = c |
f’(c) = 0 and f’(x) changes sign from negative to positive at x = c
Neither local maximum nor a local minimum if f’ (x) does not change sign at x = c |
| Second derivative test |
f’(c) = 0 and f" (x) < 0 f’(c) = 0 and f" (x) = 0 (no information if it max or min) |
f’(c) = 0 and f" (x) > 0 f’(c) = 0 and f" (x) = 0 (no information if it max or min) |
Cusp:
If f’(x) is undefined, there is a cusp at that point.
Concavity
Concave upward:
The graph lies above all its tangents. f" (x) > 0
Concave downward:
The graph lies below all its tangents. f" (x) < 0
Point of inflection at c
f ”(c) = 0 and f ”(x) changes sign at c from positive to negative. The the graph changes from concave upward to concave downward.
f ”(c) = 0 and f ”(x) changes sign at c from negative to positive. The the graph changes from concave downward to concave upward.
If f ”(c) = 0, but f ”(x) does not change sign at c, there is no point of inflection.
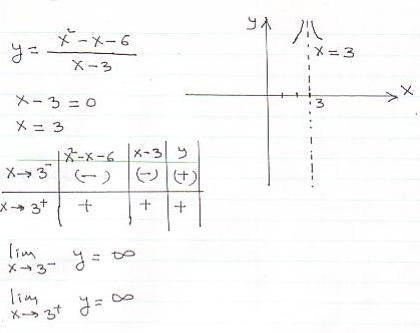
Vertical asymptotes:
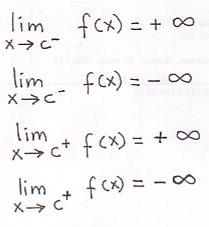
Example:
Horizontal asymptotes:
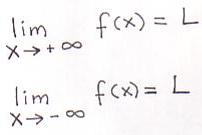
Example:
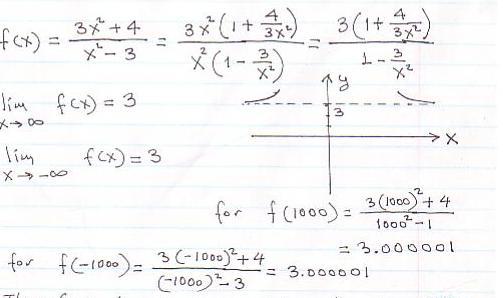
Therefore, the graph approaches the asymptote from above at +∞ and -∞
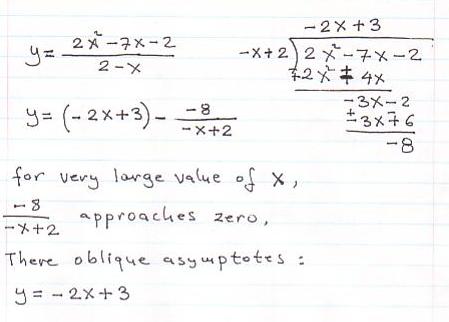
Oblique asymptotes:
They occur with rational functions in which the degree of the numerator is exactly one more than degree of denominator.
Example:
Algorithm for Curve Sketching:
Step 1: Determine any discontinuities or limitations in the domain.
For discontinuities, investigate function values on either side of the discontinuity.
Step 2: Determine any vertical asymptotes and the direction at which the curve approaches these asymptotes.
Step 3: Determine x and y intercepts.
Step 4: Determine any critical points using f’ (x) = 0
Step 5: Test critical points to see whether they are local maxima, local minima, or neither.
Step 6: Determine the behaviour of the function for large positive and large negative values of x.
This will identify horizontal asymptotes if they exist.
Step 7: Test for points of inflections.
Step 8: determine any oblique asymptotes.
Step 9: Complete the sketch.