|
Module
 1 1
|
 Finding the Answers to the Research Finding the Answers to the Research
Questions
Lesson 1-
Data Analysis Method
|
This module will give you guidance on the
appropriate method analysis of data obtained. It will enable you to think
critically and solve problems, organize and evaluate information, and
understand and manipulate data. It will guide beginner researchers to investigate,
communicate results, conceptualize framework of the research paper, and
practice the research integrity and intellectual honesty.
In the previous weeks, you learned about
the understanding and ways to collect data along with the research design,
population and sampling method, and data collection procedure.
Lesson 1 of this module will help you
familiarize on the data analysis method along with the intellectual honesty in
research.
|
|
 Learning Target Learning Target
|
|
|
In
this module, you are expected to analyze data with intellectual honesty using
suitable techniques.
|


The following terms will be
encountered in the lesson:
 Data
- factual information [as measurements or statistics] used as a basis for
reasoning, discussion, or calculation.
Data
- factual information [as measurements or statistics] used as a basis for
reasoning, discussion, or calculation.
Data
Analysis - a process of understanding data or known facts or assumptions
serving as the basis of any claims or conclusions you have about
something.
Bias
- defined as any tendency which prevents unprejudiced consideration. In
research, bias occurs when “systematic error [is] introduced into sampling or
testing by selecting or encouraging one outcome or answer over others”
Plagiarism
- is presenting someone else’s work or ideas as your own, with or without
their consent, by incorporating it into your work without full acknowledgement.
All published and unpublished material, whether in manuscript, printed or
electronic form, is covered under this definition.
 Intellectual
honesty - is honesty in the acquisition, analysis, and transmission of
ideas. A person is being intellectually honest when he or she, knowing the
truth, states that truth.
Intellectual
honesty - is honesty in the acquisition, analysis, and transmission of
ideas. A person is being intellectually honest when he or she, knowing the
truth, states that truth.

Task 1. The Prior
A. Using
a concept web, write words/ideas that you can connect to the given words (DATA
and ANALYSIS). From those words you thought, try to construct your own meaning
of DATA ANALYSIS. Use a separate sheet of paper in answering the activity.
Your own definition of the word
DATA ANALYSIS
______________________________________________________
_______________________________________________________.
B. Familiarize
yourself with dos and don’ts in citing sources in research. Then group the
words accordingly using the template. Use a separate sheet of paper in
answering the activity.
 Plagiarism Honesty Selective Reporting Impartiality
Disinformation Fabrication Transparency Logical Fallacies
Proper
Citation Bias Intellectual Property Rights False
Analogies
|
Correct
Practice
|
Wrong
Practice
|
|
|
|
|
|
|
|
|
|
|
|
|
|
|
|

Data Analysis Methods
In reporting the results, the researcher
stays close to the statistical findings without drawing broader implications or
meaning from them. Further, this section includes summaries of the data rather
than the raw data (e.g., the actual scores for individuals). A results section
includes tables, figures, and detailed explanations about the statistical
results.
Before writing this section:
Rewrite the Chapters 1-3 before or after data
analysis and before writing Chapter 4.
Rewrite the chapters in past tense, wherever
applicable, and make corrections for actual data collection and data analysis
procedures.
What is the first thing that comes to mind
when we see data? The first instinct is to find patterns, connections, and
relationships. We look at the data to find meaning in it.
Similarly, in research, once data is
collected, the next step is to get insights from it. For example, if a clothing
brand is trying to identify the latest trends among young women, the brand will
first reach out to young women and ask them questions relevant to the research
objective. After collecting this information, the brand will analyze that data
to identify patterns — for example, it may discover that most young women would
like to see more variety of jeans.
Data analysis is how researchers go from a
mass of data to meaningful insights. There are many different data analysis methods,
depending on the type of research. Here are a few methods you can use to
analyze quantitative and qualitative data.
Analyzing Qualitative Data
Qualitative data
analysis works a little differently from quantitative data, primarily because
qualitative data is made up of words, observations, images, and even symbols.
Deriving absolute meaning from such data is nearly impossible; hence, it is
mostly used for exploratory research. While in quantitative research there is a
clear distinction between the data preparation and data analysis stage,
analysis for qualitative research often begins as soon as the data is
available.
Data Preparation and Basic Data Analysis
Analysis and preparation happen
in parallel and include the following steps:
1. Getting familiar with the data: Since
most qualitative data is just words, the researcher should start by reading the
data several times to get familiar with it and start looking for basic
observations or patterns. This also includes transcribing the data.
2. Revisiting research objectives: Here,
the researcher revisits the research objective and identifies the questions
that can be answered through the collected data.
3. 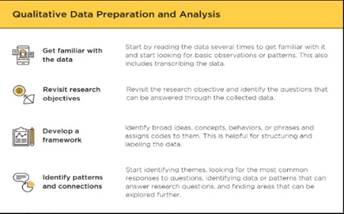 Developing a framework: Also known as
coding or indexing, here the researcher identifies broad ideas, concepts,
behaviors, or phrases and assigns codes to them. For example, coding age,
gender, socioeconomic status, and even concepts such as the positive or
negative response to a question. Coding is helpful in structuring and labeling
the data.
Developing a framework: Also known as
coding or indexing, here the researcher identifies broad ideas, concepts,
behaviors, or phrases and assigns codes to them. For example, coding age,
gender, socioeconomic status, and even concepts such as the positive or
negative response to a question. Coding is helpful in structuring and labeling
the data.
4. Identifying patterns and connections:
Once the data is coded, the research can start identifying themes, looking for
the most common responses to questions, identifying data or patterns that can
answer research questions, and finding areas that can be explored further.
Qualitative Data Analysis Methods
Several methods are available to analyze
qualitative data. The most commonly used data analysis methods are:
•
Content
analysis: This is one of the most common methods to analyze qualitative
data. It is used to analyze documented information in the form of texts, media,
or even physical items. When to use this method depends on the research
questions. Content analysis is usually used to analyze responses from
interviewees.
•
Narrative
analysis: This method is used to analyze content from various sources, such
as interviews of respondents, observations from the field, or surveys. It
focuses on using the stories and experiences shared by people to answer the
research questions.
•
Framework
analysis. This is more advanced method that consists of several stages such
as familiarization, identifying a thematic framework, coding, charting, mapping
and interpretation.
•
Discourse
analysis: Like narrative analysis, discourse analysis is used to analyze
interactions with people. However, it focuses on analyzing the social context
in which the communication between the researcher and the respondent occurred.
Discourse analysis also looks at the respondent’s day-today environment and
uses that information during analysis.
•
Grounded
theory: This refers to using qualitative data to explain why a certain
phenomenon happened. It does this by studying a variety of similar cases in
different settings and using the data to derive causal explanations.
Researchers may alter the explanations or create new ones as they study more
cases until they arrive at an explanation that fits all cases.
These methods are the ones used most
commonly. However, other data analysis methods, such as conversational
analysis, are also available.
Qualitative data analysis can also be conducted through the following
three steps:
Step 1: Developing and Applying Codes. Coding can be explained as
categorization of data. A ‘code’ can be a word or a short
phrase that represents a theme or an idea. All codes need to be assigned
meaningful titles. A wide range of non-quantifiable elements such as events,
behaviors, activities, meanings etc. can be coded.
There are three types of coding:
1. Open coding. The initial organization of
raw data to try to make sense of it.
2. Axial coding. Interconnecting and
linking the categories of codes.
3. Selective coding. Formulating the story
through connecting the categories. Coding can be done manually or using
qualitative data analysis software such as
NVivo, Atlas ti 6.0, Hyper RESEARCH 2.8, Max QDA and others.
When using manual coding you can use folders, filing
cabinets, wallets etc. to gather together materials that are examples of
similar themes or analytic ideas. Manual method of coding in qualitative data
analysis is rightly considered as laborintensive, time-consuming and outdated.
In computer-based coding, on the other
hand, physical files and cabinets are replaced with computer based directories
and files. When choosing software for qualitative data analysis you need to
consider a wide range of factors such as the type and amount of data you need
to analyze, time required to master the software and cost considerations.
Moreover, it is important to get
confirmation from your dissertation supervisor prior to application of any
specific qualitative data analysis software.
The following
table contains examples of research titles, elements to be coded and
identification of relevant codes:
|
Research title
|
Elements to be coded
|
Codes
|
|
Born or bred: revising The
Great Man theory of
leadership in the
21st century
|
Leadership practice
|
Born leaders
Made leaders
Leadership effectiveness
|
|
A study into advantages
and disadvantages of
various entry strategies to
Chinese market
|
Market entry strategies
|
Wholly-owned
subsidiaries
Joint-ventures
Franchising
Exporting
Licensing
|
|
Impacts of CSR programs
and initiative on brand
image: a case study of
Coca-Cola Company UK.
|
Activities, phenomenon
|
Philanthropy
Supporting charitable
courses
Ethical behavior
Brand awareness Brand value
|
|
An investigation into the ways of
customer
relationship management in mobile
marketing environment
|
Tactics
|
Viral messages
Customer retention
Popularity of social networking sites
|
Qualitative data coding
Step
2: Identifying themes, patterns and relationships. Unlike quantitative
methods, in qualitative data analysis there are no universally applicable
techniques that can be applied to generate findings. Analytical and critical
thinking skills of researcher plays significant role in data analysis in
qualitative studies. Therefore, no qualitative study can be repeated to
generate the same results.
Nevertheless, there is a set of
techniques that you can use to identify common themes, patterns and
relationships within responses of sample group members in relation to codes
that have been specified in the previous stage.
Specifically, the most popular and
effective methods of qualitative data interpretation include the following:
§ Word
and phrase repetitions – scanning primary data for words and phrases
most commonly used by respondents, as well as, words and phrases used with
unusual emotions;
§ Primary
and secondary data comparisons – comparing the findings of
interview/focus group/observation/any other qualitative data collection method
with the findings of literature review and discussing differences between them;
§ Search
for missing information – discussions about which aspects of the issue
was not mentioned by respondents, although you expected them to be mentioned;
§ Metaphors
and analogues – comparing primary research findings to phenomena from a
different area and discussing similarities and differences.
Step
3: Summarizing the data. At this last stage you need to link research
findings to hypotheses or research aim and objectives. When writing data
analysis chapter, you can use noteworthy quotations from the transcript in
order to highlight major themes within findings and possible contradictions.
It is important
to note that the process of qualitative data analysis described above is
general and different types of qualitative studies may require slightly
different methods of data analysis.
Analyzing Quantitative Data Data Preparation
The first stage
of analyzing data is data preparation, where the aim is to convert raw data
into something meaningful and readable. It includes four steps:
Step 1: Data Validation
The purpose of data validation is to find
out, as far as possible, whether the data collection was done as per the
pre-set standards and without any bias. It is a fourstep process, which
includes…
•
 Fraud, to infer whether each respondent
was actually interviewed or not.
Fraud, to infer whether each respondent
was actually interviewed or not.
•
Screening,
to make sure that respondents were chosen as per the research criteria.
•
Procedure,
to check whether the data collection procedure was duly followed.
•
Completeness,
to ensure
that the interviewer asked the respondent all the
questions, rather than just a few required quantitative-data-analysis-methods/ ones.
To do this, researchers would need to pick
a random sample of completed surveys and validate the collected data. (Note
that this can be time-consuming for surveys with lots of responses.) For
example, imagine a survey with 200 respondents split into 2 cities. The
researcher can pick a sample of 20 random respondents from each city. After
this, the researcher can reach out to them through email or phone and check
their responses to a certain set of questions.
Step 2: Data Editing
Typically, large data sets include errors.
For example, respondents may fill fields incorrectly or skip them accidentally.
To make sure that there are no such errors, the researcher should conduct basic data checks, check for outliers, and
edit the raw research data to identify and clear out any data points that may
hamper the accuracy of the results.
For example, an error could be fields that
were left empty by respondents. While editing the data, it is important to make
sure to remove or fill all the empty fields.
Step 3: Data Coding
This is one of the most important steps in data
preparation. It refers to grouping and assigning values to responses from the
survey.
For example, if
a researcher has interviewed 1,000 people and now wants to find the average age
of the respondents, the researcher will create age buckets and categorize the
age of each of the respondent as per these codes. (For example, respondents
between 13-15 years old would have their age coded as 0, 16-18 as 1, 18-20 as
2, etc.)
Then during analysis, the researcher can
deal with simplified age brackets, rather than a massive range of individual
ages.
Quantitative Data Analysis Methods
After these
steps, the data is ready for analysis. The two most commonly used quantitative
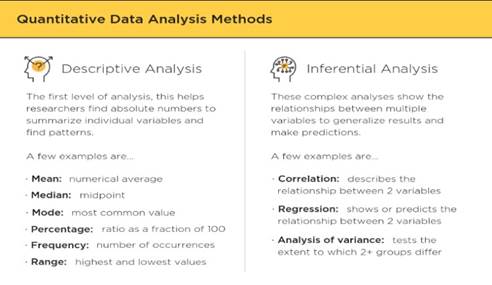
data analysis methods are descriptive statistics and inferential statistics.
Descriptive Statistics
Typically descriptive statistics (also
known as descriptive analysis) is the first level of analysis. It helps
researchers summarize the data and find patterns. A few commonly used
descriptive statistics are:
•
Mean:
numerical average of a set of values.
•
Median:
midpoint of a set of numerical values.
•
Mode:
most common value among a set of values.
•
Percentage:
used to express how a value or group of respondents within the data relates to
a larger group of respondents.
•
Frequency:
the number of times a value is found.
•
Range:
the highest and lowest value in a set of values.
 Descriptive
statistics provide absolute numbers. However, they do not explain the rationale
or reasoning behind those numbers. Before applying descriptive statistics, it’s
important to think about which one is best suited for your research question
and what you want to show. For example, a percentage is a good way to show the
gender distribution of respondents.
Descriptive
statistics provide absolute numbers. However, they do not explain the rationale
or reasoning behind those numbers. Before applying descriptive statistics, it’s
important to think about which one is best suited for your research question
and what you want to show. For example, a percentage is a good way to show the
gender distribution of respondents.
Descriptive statistics are most helpful when the research
is limited to the sample and does not need to be generalized to a larger
population. For example, if you are comparing the percentage of children
vaccinated in two different villages, then descriptive statistics is enough.
Since descriptive analysis is
mostly used for analyzing single variable, it is often called univariate
analysis.
Intellectual Honesty is an applied
method of problem solving,
characterized by an unbiased, honest attitude, which can be demonstrated in a
number of different ways including:
•
Ensuring support for chosen ideologies does not
interfere with the pursuit of truth;
•
Relevant facts and information are not
purposefully omitted even when such things may contradict one's hypothesis;
•
Facts are presented in an unbiased manner, and
not twisted to give misleading impressions or to support one view over another;
•
References, or earlier work, are acknowledged
where possible, and plagiarism is avoided.
Ten Signs of Intellectual Honesty
1. Do not overstate the power of your argument.
One’s sense of conviction should be in proportion to the level of clear
evidence assessable by most. If someone portrays their opponents as being
stupid or dishonest for disagreeing, intellectual dishonesty is probably in
play. Intellectual honesty is most often associated with humility, not
arrogance.
2. Show willingness to publicly acknowledge
that reasonable alternative viewpoints exist. The alternative views do not
have to be treated as equally valid or powerful, but rarely is it the case that
one and only one viewpoint has a complete monopoly on reason and evidence.
3. Be willing to publicly acknowledge and
question one’s own assumptions and biases. All of us rely on assumptions
when applying our world view to make sense of the data about the world. And all
of us bring various biases to the table.
4. Be willing to publicly acknowledge where
your argument is weak. Almost all arguments have weak spots, but those who
are trying to sell an ideology will have great difficulty with this point and
would rather obscure or downplay any weak points.
5. Be willing to publicly acknowledge when you
are wrong. Those selling an ideology likewise have great difficulty
admitting to being wrong, as this undercuts the rhetoric and image that is
being sold. You get small points for admitting to being wrong on trivial
matters and big points for admitting to being wrong on substantive points. You
lose big points for failing to admit being wrong on something trivial.
6. Demonstrate consistency. A clear sign
of intellectual dishonesty is when someone extensively relies on double
standards. Typically, an excessively high standard is applied to the perceived
opponent(s), while a very low standard is applied to the ideologues’ allies.
7. Address the argument instead of attacking
the person making the argument. Ad hominem arguments are a clear sign of
intellectual dishonesty. However, often times, the dishonesty is more subtle.
For example, someone might make a token effort at debunking an argument and
then turn significant attention to the person making the argument, relying on
stereotypes, guilt-by-association, and innocentsounding gotcha questions.
8. When addressing an argument, do not
misrepresent it. A common tactic of the intellectually dishonest is to
portray their opponent’s argument in straw man terms. In politics, this is
called spin. Typically, such tactics eschew quoting the person in context, but
instead rely heavily on out-of-context quotes, paraphrasing and impression.
When addressing an argument, one should shows signs of having made a serious
effort to first understand the argument and then accurately represent it in its
strongest form.
9. Show a commitment to critical thinking.
10. Be willing to publicly acknowledge when a
point or criticism is good. If someone is unable or unwilling to admit when
their opponent raises a good point or makes a good criticism, it demonstrates
an unwillingness to participate in the give-and-take that characterizes an
honest exchange.
While no one is
perfect, and even those who strive for intellectual honesty can have a bad day,
simply be on the lookout for how many and how often these criteria apply to
someone. In the arena of public discourse, it is not intelligence or knowledge
that matters most – it is whether you can trust the intelligence or knowledge
of another. After all, intelligence and knowledge can sometimes be the best
tools of an intellectually dishonest approach.

Practice Task 1. Honest Test
A. Certain forms
of communications may influence your beliefs or decision making. These
communications may include: product advertisements, sales materials, blog
posts, social media, news reports, medical advice, nutritional advice,
editorials, sermons, appeals to support some issue, organization, or cause;
political speeches, books, lectures, research reports, documentary films,
rumors, or routine conversations. Accomplish the table below based on the forms
of communication. Use a separate sheet of paper in answering the activity.
|
Column A
|
Column B
|
|
Intellectually Honest
Form of Communication
|
Misleading Form of Communication
|
|
|
|
|
|
|
|
|
|
.
Practice Task 2. Gather and
Analyze
Collect at least 5 data sets using interview
method on the preference of housemates or neighbors for TV shows and their
reasons for their choice. Write down their opinions using the different stages
of data analysis. Present a summary of your findings. Use a separate sheet of
paper in answering the activity.
Practice Task 3. Justify
Why
should researchers identify the data analysis method that is appropriate to
your study? Explain your answer in a separate sheet of paper.
___________________________________________________________________
___________________________________________________________________
___________________________________________________________________
Rubric: Critical
Thinking -
30%
Appropriateness -
20%
Content
-
30%
Organization - 20%
100%
Additional Tasks
Task 1: The Venn
Give the differences and similarities of Qualitative and Quantitative data
analysis using Venn diagram. Do this on a separate sheet of paper.
Task 2: Analyzing Data
Analyze and
evaluate the result of the conducted survey of the researchers. From Grades 11
and 12 informants’ various responses, the problem is being answered which aims
to enumerate the teachers’ attitudes that are perceived by the students. Based
on the data gathered there are favorable and unfavorable attitudes that the
informants perceived as they connected with their teachers. Use a separate
sheet of paper in answering the activity.
|
TEACHERS’
ATTITUDES
|
NO. OF RESPONSES FROM THE INFORMANTS
|
|
Favorable
Attitudes
|
|
Long patience
|
32
|
|
Caring to students
|
34
|
|
Kind personality
|
31
|
|
Dedication to teaching
|
40
|
|
Enthusiasm
|
24
|
|
Punctual
|
18
|
|
Unfavorable
Attitudes
|
|
Lack of confidence
|
3
|
|
Strict
|
29
|
|
Arrogant
|
2
|
|
Standard level
|
30
|
|
Teaching nonchalantly
|
6
|
|
Always late
|
4
|
Table 1. Teachers’ Attitudes that Perceived
by the Students
|
Procedure 25%
Execution 25%
Interpretation 50%
100
|
Consider the following the rubrics:
%

A. Identification
Instruction: Provide the correct
answer of each item and write it in your notebook or separate sheet of paper.
________________
1. It is applied method of problem solving,
characterized by an unbiased, honest attitude.
________________
2. This is how researchers go from a mass of data to meaningful insights
________________ 3. Interconnecting
and linking the categories of codes.
________________
4. It is also known as descriptive analysis—the first level of analysis
________________
5. Can be a word or a short phrase that represents a theme or an idea
B.
Enumeration
Instruction: Enumerate the items
asked and write your answers in a separate sheet of paper.
6-10 What are the methods to
analyze qualitative data?
11-12 What are two most commonly
used quantitative data analysis methods.
13-18 Enumerate the few commonly
used descriptive statistics.
19-20 Give 2 importance of
intellectual honesty in research.
C.
Essay
1.
Why is it important that a researcher must have
in-depth understanding of the different data analysis methods? (2 points)
2.
Write in your own words one (1) paragraph
description of either quantitative or qualitative data analysis. Include its
relevance in your research problem and how it will assist you to qualify the
data gathered. (5 points)

Task 1: Defining Interpretation of Data
• What
is interpretation of data referred to in research?
Task 2: Determining Presentation of Data
• What
are the ways to present the data gathered in your study?
Points to Ponder
v  Data
analysis is perhaps the most important component of research. Weak analysis
produces inaccurate results that not only hamper the authenticity of the
research but also make the findings unusable. It’s imperative to choose your
data analysis methods carefully to ensure that your findings are insightful and
actionable.
Data
analysis is perhaps the most important component of research. Weak analysis
produces inaccurate results that not only hamper the authenticity of the
research but also make the findings unusable. It’s imperative to choose your
data analysis methods carefully to ensure that your findings are insightful and
actionable.
v Exercise
moral virtue, find the facts, increase respect, seek insights, and search for
common ground whenever you share ideas with others. Because false beliefs are
often harmful, we have moral obligation to seek true beliefs. Challenge
dishonesty in yourself and other

WARMING UP:
The
Prior
A.
Definition:
Data
Analysis (in research) research data analysis is a process used by researchers
for reducing data to a story and interpreting it to derive insights. The data
analysis process helps in reducing a large chunk of data into smaller
fragments, which makes sense. ( LeCompte
and Schensul)
B. Familiarize yourself with do’s
and don’ts in citing sources in research. Then group the words accordingly
using the template.
 Plagiarism Honesty Selective Reporting Impartiality
Disinformation
Logical Fallacies Proper Citation Bias
Intellectual
Property Rights False
Analogies
|
Correct
Practice
|
Wrong
Practice
|
|
 Honesty Honesty
|
 Plagiarism Plagiarism
|
|
 Proper
Citation Proper
Citation
|
 Selective
Reporting Selective
Reporting
|
|
 Intellectual
Property Rights Intellectual
Property Rights
|
 Impartiality Impartiality
|
|
|
 Disinformation Disinformation
|
|
|
 Logical
Fallacies Logical
Fallacies
|
|
|
 Bias Bias
|
|
|
 False
Analogies False
Analogies
|
Practice Task 1. Honest Test
A. Certain forms
of communications may influence your beliefs or decision making. These
communications may include: product advertisements, sales materials, blog
posts, social media, news reports, medical advice, nutritional advice,
editorials, sermons, appeals to support some issue, organization or cause;
political speeches, books, lectures, research reports, documentary films,
rumors, or routine conversations. Accomplish the table below based on the forms
of communication.
|
Column A
|
Column B
|
|
Intellectually Honest Form of Communication
|
Misleading Form of Communication
|
|
Medical advise
|
Product
advertisement
|
|
Sermons
|
Social media
|
|
appeals to support some issue
|
editorials
|
|
research reports
|
rumors routine conversations
|
|
documentary films
|
sales materials
|
|
nutritional advice
|
news reports
|
|
blog posts
|
political speeches
|
|
Books
|
|
|
, lectures
|
|
.
Practice Task 2. Gather and Analyze Answers may vary.
Practice Task 3. Justify Answers may
vary.
Additional Tasks
Task
1: The
Venn
.
Give the
differences and similarities of Qualitative and Quantitative data analysis
using Venn diagram.
|
Qualitative Analysis Method
|
Similarities
|
|
Quantitative Analysis Method
|
|
made up of words/ Textbased
|
|
|
Number-based
|
|
Subjective
|
Both can display data graphically
|
|
Objective
|
|
More in-depth information on a few cases
|
|
Both produce
data to analyze
|
|
Less in-depth but more breadth of
information across a large number of cases
|
|
|
|
No statistical
tests
|
|
|
Statistical tests are used for analysis
|
|
Content and narrative analysis
|
|
|
Descriptive statistics
|
|
seeks to discover patterns such as changes
over time or possible causal links between variables.
|
|
|
|
Task 2: Analyzing data
• Analyze
and evaluate the result of the conducted survey of the researchers. From Grades
11 and 12 informants’ various responses, the problem is being answered which
aims to enumerate the teachers’ attitudes that perceived by the students. Based
from the data gathered there are favorable and unfavorable attitudes that the
informants perceived as they connected with their teachers.
|
TEACHERS’ ATTITUDES
|
NO. OF RESPONSES FROM
THE INFORMANTS
|
|
Favorable Attitudes
|
|
Long patience
|
32
|
|
Caring to students
|
34
|
|
Kind personality
|
31
|
|
Dedication to teaching
|
40
|
|
Enthusiasm
|
24
|
|
Punctual
|
18
|
|
Unfavorable Attitudes
|
|
Lack of confidence
|
3
|
|
Strict
|
29
|
|
Arrogant
|
2
|
|
Standard level
|
30
|
|
Teaching nonchalantly
|
6
|
|
Always late
|
4
|
Table 1. Teachers’ Attitudes that Perceived
by the Students
|
Procedure 25%
Execution 25%
Interpretation 50%
100
|
• Consider
the following the rubrics:
%
Table 1 shows the result from
the conducted survey regarding the teachers’ attitudes that the fifty-one
students of Grades 11 and 12 perceived. Based on the table, 32 out of 51
informants perceived that some of their teachers have long patience, 34 out of 51
respond that their teachers are caring about them, 31 out of 51 informants view
their teachers possessing the kind personality, out of 51 informants 40 of them
see their teachers as dedicated to teaching, 24 out of 51 respond that their
teachers shows enthusiasm, 18 informants respond that some of their teachers
are punctual.
However, teachers also have their
unfavorable attitude that they need to somehow modify, if possible. As shown in
the table, 3 out of 51 informants observed that some of their teachers lack of
confidence in teaching, 29 of them perceived some teachers as strict, 2
informants noticed that there is/are teacher/s who are being arrogant, 30 out
of 51 perceived some of their teachers having standard level (regardless how low
or high it is), there are 6 students out of 51 view their teachers teaching
nonchalantly, and out of 51, 4 students observed that some of their teachers
are always late in class.
Based on the result, the researchers
found the most observable teachers’ positive and negative attitudes that
constantly perceived by the students. In favorable attitudes, (78% of the
informants respond) dedication to teaching is the most remarkable in the
teachers they perceived their teachers as dedicated to what they are doing.
Second, the students observed that their teachers are caring to the students
(with 67% of the informants’ response) regardless of their way of showing care.
Third, 63% of the informants agreed that some of their teachers have long patience
attitude and can compromise with the students’ behaviors. Then 61% of the
students affirmed that some of their teachers have kind personality who is
considerate in so many ways. There are students who also perceived their
teachers as enthusiastic (47% of response) in their fields who show active
interest to whatever they are doing. There are students who observed that some
of their teachers are punctual (35% agreed), who arrive and do things at
expected time.
In teachers’ unfavorable attitudes,
the most perceivable attitude is having a set standard level (59%) to the
students regardless of how low or high it is. Next is teacher’s acquiring an
attitude of being strict (57% agreed). There are some informants who also
observed that some of their teachers teach nonchalantly (12%) as some teachers
discuss lesson apathetically. Some of the students (8% of the informants)
agreed that some of their teachers came late in class. And 6% of the students
noticed that some of their teachers are lacking of confidence in teaching. With
regards to the variable, informants have their own feeling of emotions that
they felt whenever they encounter those attitudes of the teachers. Majority
(67%) of the respondents said that they are happy when they see and feel their
teachers possessed the positive attitudes.
This result implies that teachers
indeed affect students’ willingness, activeness and motivation in different
aspects of life learning. There are informants stated that the mood of the
teachers affect the entire class, teachers’ attitude influence the learners’
behavior and performance inside the classroom in front of the educators.
The results give the researchers
an idea that the students are aware of the teachers’ attitudes, and its impact
to their learning holistically. Nevertheless, based on the result, the teachers
of Mariano Suarez High School have favorable attitudes that create productive
students as they collaborate with one another, and also unfavorable attitudes
that need to minimize for better individuals.
COOLING DOWN
A.
Identification
1.
Intellectual Honesty
2.
Data Analysis
3.
Axial Coding
4.
Descriptive Statistics
5.
Code
B.
Enumeration
6.
Content analysis
7.
Narrative analysis
8.
Framework analysis
9.
Discourse analysis
10.
Grounded theory
11.
Descriptive Statistics
12.
Inferential Statistics
13.
Mean
14.
Median
15.
Mode
16.
Percentage
17.
Frequency
18.
Range
19.
Answer may vary
20.
Answer may vary
C. Essay
Answer may vary.
LEARNING CHALLENGE
Task 1: Defining Interpretation of Data
Answers may vary
Task
2: Determining Presentation of Result Answers may vary
References
BHATIA,
MANU (2018). Your Guide to Qualitative and Quantitative Data Analysis Methods. Humans of Data Atlan. from
https://humansofdata.atlan.com/2018/09/qualitative-quantitative-data-analysismethods/
Chua, Von Christopher. (2018) Inquiries, Investigations and
Immersion. MATHBYCHUA from https://mathbychua.weebly.com/inquiries-investigations-andimmersion.html
Cristobal, De la Cruz Cristobal
(2017)Practical Research 1 for Senior High School 1.C & E Publishing, Inc.
Department of Education-Bureau of Learning Resources
(2016). Practical Research 1: Teacher’s Guide. Pasig City, Philippines: Lexicon
Press, Inc.
Dizon, H. (2019) EFFECTS OF
TEACHERS’ ATTITUDES TO THE PERFORMANCE OF THE SHS STUDENTS (Chapter III):
Pamplona High School.
Gray,
D. E. (2020). Doing Research in Business World: Sage Publishing https://study.sagepub.com/grayresearchbusiness2/student-resources/multiplechoice-quizzes
Pearson Education, Inc.,
publishing as Pearson Prentice Hall Legal
and Privacy Terms Copyright
© 1995-2010.
fromhttps://wps.prenhall.com/chet_airasian_edresearch_7/5/1490/381467.cw/index.
html
Prieto, N. G., Naval, V. C.,
Carey, T. G. (2017). Practical Research 2: Quantitative Research. Metro Manila:
LORIMAR PUBLISHING, INC.
Prieto, N. G., Naval, V. C.,
Carey, T. G. (2017). Practical Research 1: Qualitative Research. Metro Manila:
LORIMAR PUBLISHING, INC.
Research Methodoloy. Qualitative
Data Analysis.
https://research-methodology.net/research-methods/data-analysis/qualitative-dataanalysis/
Toledo-Pereyra, Luis. (2009).
Intellectual Honesty. Journal of investigative surgery: the official journal of
the Academy of Surgical Research. 15. 113-4.
10.1080/08941930290085868.
https://www.researchgate.net/publication/11241783_Intellectual_Honesty
https://www.ncbi.nlm.nih.gov/pmc/articles/PMC2917255/#:~:text=I.-
,Definition%20and%20scope%20of%20bias,or%20answer%20over%20others%E2%
80%9D%207. https://www.ox.ac.uk/students/academic/guidance/skills/plagiarism#:~:text=Plagiaris
m%20is%20presenting%20someone%20else's,is%20covered%20under%20this%20
definition.
https://www.merriam-webster.com/dictionary/analysis
 Borrowed
materials (i.e., songs, stories, poems, pictures, photos, brand names,
trademarks, etc.) included in this book are owned by their respective copyright
holders. Every effort has been exerted to locate and seek permission to use
these materials from their respective copyright owners. The publisher and
authors do not represent nor claim ownership over them.
Borrowed
materials (i.e., songs, stories, poems, pictures, photos, brand names,
trademarks, etc.) included in this book are owned by their respective copyright
holders. Every effort has been exerted to locate and seek permission to use
these materials from their respective copyright owners. The publisher and
authors do not represent nor claim ownership over them.