TREND OF SOLID WASTE COLLECTION IN URBAN RIVER,
STUDY CASE: BATU RIVER, KUALA LUMPUR
AB-WAHID, M
ABU-BAKAR, A. A.
Lecturer, Water Resources & Environmental System,
Faculty of Civil Engineering, Universiti Teknologi MARA,
Shah Alam, Selangor, MALAYSIA
SABARUDIN, S.
Undergraduate, Faculty of Civil Engineering,
Universiti Teknologi MARA, Shah Alam, Selangor, MALAYSIA
INTRODUCTION
Malaysia has some of the most beautiful rivers in the world. There are some 150 river systems in Peninsular Malaysia and a further 50 river systems in Sabah and Sarawak. Since the beginning of civilization, rivers have played a major and important role in shaping and influencing the development of the nation and the cultures of its people. Almost all major towns in Malaysia are located beside a river. Kuala Lumpur was founded on the confluence of the Klang and Gombak Rivers. Apart from these prominent historical heritages, Malaysian rivers have also provided a means of transport, helps to establish ports and towns, brought new settlers inland, irrigated the land, generated hydropower, and influenced the culture and traditions of the people. Rivers in Malaysia, sharing a wide variety of flora and fauna, also offer tremendous recreational opportunities.
The river at source is unpolluted but after human use, the water becomes dirty and disgusting. River water quality deterioration is synonymous with development and is the result of pollution. From data compiled by the Department of Environment, the overall trend points to a slow but steady deterioration in the water quality of rivers around the country. Of 116 rivers monitored, 42 are rated as clean, 61 slightly polluted and 13 polluted.
River pollution and garbage dumping in rivers has become an ordinary situation and the government for many years had treated this problem. Today, rivers have been treated to be one channel of rubbish dumping area. This can be proven by the amount of garbage collection collected each day by the collectors. This case might have been caused by the land use activities near along the river and also the weather conditions. Garbage is collected from the garbage trap installed at some part of the river. The polluted river gives many negative impacts to the environment, health, and economy. Until today, no solution has yet been discovered to overcome this problem or at least to prevent the public from dumping garbage in river effectively.
This study was designed to determine the solid waste collection at the floating boom and cost involved for Batu River, Selangor. It is also to analyze the trend of solid waste collection in that river. This research emphasizes on the effect of land use changes and climatic changes to solid waste collection in urban river.
STUDY AREA
The study area for this research was selected at Batu River in Kuala Lumpur. The selected floating boom is near Batu Complex Station 4 as shown in Figure 1. Batu River is one of the main rivers in Kuala Lumpur. Overall length for Batu River is 24 km, length of this river across Kuala Lumpur area is 8.1 km and this river covers 145km2 catchment areas. Tributaries of Batu River are Jinjang River with 4.4 km length across Kuala Lumpur area and Keroh River with 8.6 km length across Kuala Lumpur area. (Yew, 2005)
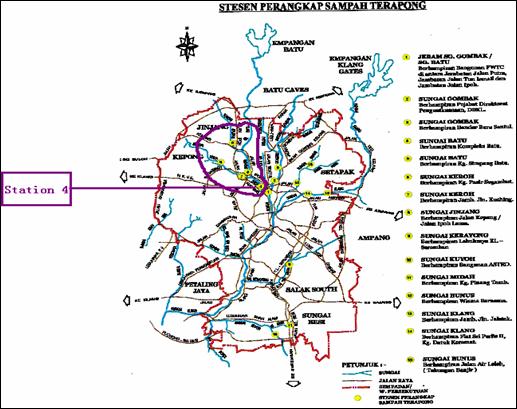
(Source: Yew, 2005)
Figure 1: Locations of floating boom station.
The main reason Batu River was selected as a case study is because this river is one of the most critical river in Kuala Lumpur.
LANDUSE TYPE
Batu River is in the area of Jinjang located at a northern part of Kuala Lumpur. The landuse patterns in this area can be characterized, generally, into six categories: residential, commercial, industrial, undeveloped land, squatters and infrastructure and facilities. as shown in Figure 2 and the urbanization trend for Jinjang area is in Figure 3a and Figure 3b.Land use changes of Jinjang area from 1984 to 2000 is used as an initial data for land use type.
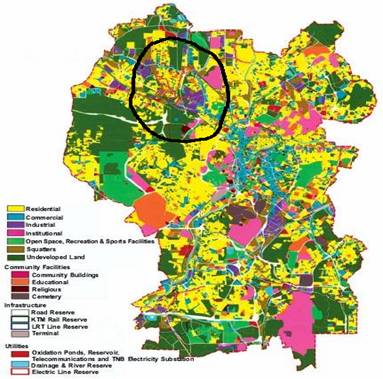
(Source:KLSP,2000)
Figure 2: Landuse ,2000
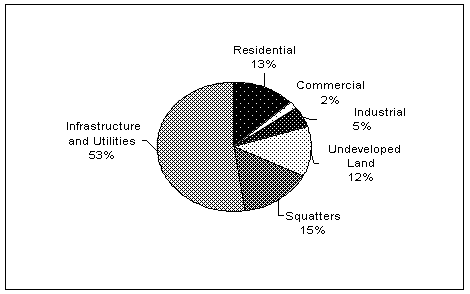
(Source: KLSP, 2000)
Figure 3a: Urbanization trend for Jinjang Area (1984-2000)
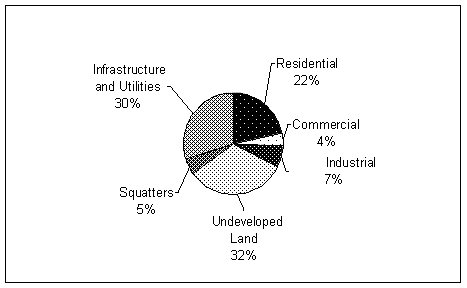
(Source: KLSP, 2000)
Figure 3b: Urbanization trend for Jinjang Area (1984-2000)
Residential
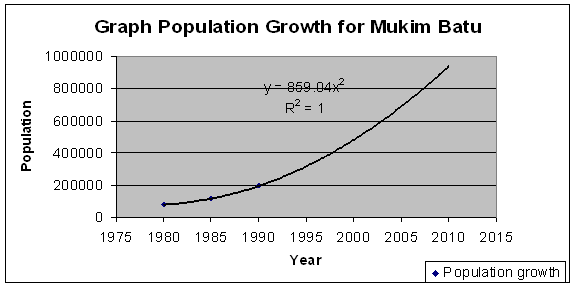
The distribution pattern shows residential area is increasing. Probably this value will increase for a few years more. Therefore the population growth is also increased and by the year 2010 the value will achieve more than 800,000 people.
(Source: Jamilah )
Industry
Industrial activity will promote to economic production which involves large amounts of upfront capital investment before any profit can be realized. The number for industrial activity is increasing and this including the legal and illegal operations. Industrial activity can be said to contribute the worst in river pollution issues.
Squatters
Squatters are often categorized as the urban poor because the majority of the city’s lower income group live in squatters areas. Squatters area are often portrayed as villages in the city which are cluttered, lack infrastructure facilities and are exposed to fire, floods and other natural disasters over the years (Nordin,1996).Until 1984 squatters areas have grown in such large size and numbers that it has a strong influence on the planning of Kuala Lumpur. The land use pattern shows towards the year 2000 the number is decreased.
CLIMATIC CHANGES
Weather and climate are among the foremost factors that determine how the society develops in a geographical region. Daily fluctuations of the atmosphere are called weather while climate is typically the average state of atmosphere observed over a finite time period for a number of years (Kavvas, 2006).Kuala Lumpur is generally warm throughout the year with temperature ranging from 23°C to 32°C.Annual rainfallvaries from 1840mm to 2700mm.Mean relative humidity is 81% moisture content, with mean annual evaporation amount estimated about 1070mm (Harith, 2001). Generally there are two season.The dry season occurs during the south-west monsoon from May and September. The north-east monsoon brings the rainy season to this area during mid-November till March.
METHODOLOGY
Rainfall Data
Record of rainfall data in Kuala Lumpur was obtained from the Department of Irrigation and Drainage, Kuala Lumpur. The data comprises of the daily total of rain collected for one year period. The value of the rainfall data is measured in millimeter (mm).
Data Processing
This is the stage where all data obtained processed. The processed data was analyzed in the next stage of the methodology. From the previous stage, data that was obtained were the river solid waste collection which contains the date of collection, amount of collection collected and the cost of service from the agencies involved. Besides that rainfall data of the study area was also collected and contains the date and the daily rainfall event
Data Analysis
The data was analyzed by comparing the river waste collection, rainfall event and the costing involved from the specified date given. The trend of river solid waste collection due to weather and the costing involved were described from the graph constructed.
The solid waste production forecasting is to predict the cost that the government need spend on the collection activities and how much solid waste is expected to be produced in the future. In order to do this, it is noted that the variables are most likely to effect cost of the solid waste collection, type of weather for the particular day and the amount of waste produced.
The problem objective in this situation is to analyze the relationship between quantative variables. For this purpose, the statistical technique used is called regression analysis, which is an analysis of the relationship between one continuous dependent variable and a set of independent variables, x1, x2,…xn. The relationship is given in the form of an equation that allows predicting the dependent variable from a function of the independent variable and a set of constant called the parameters.
RESULTS
Collection and the Cost
Graph 1 shows the annual collection and the cost of each collection of solid waste in Batu River. The graph shows that the collection volume increased every year. This will affect the cost of collection which is also increase. The annual collection for the year 2000 was 437.64 tones with the cost of collection is about RM 13 731.14. The volume of collection was increased about 7.3% for the year 2001, 27.9% for the year 2002, 54.6% for the year 2003 and 32.7% for the year 2004. The cost of collection was also increased about 11.2% for the year 2001, 28.9% for the year 2002, 54.1% for the year 2003 and 36.1% for the year 2004.
TABLE 1: Annual Collection and the Cost for Year 2000-2004
|
Year |
2000 |
2001 |
2002 |
2003 |
2004 |
|
Annual Collection (Tones) |
437.64 |
472.06 |
607.77 |
963.26 |
650.33 |
|
Annual Cost (RM) |
13,731.14 |
15,457.61 |
19,330.88 |
29,890.70 |
21,497.24 |
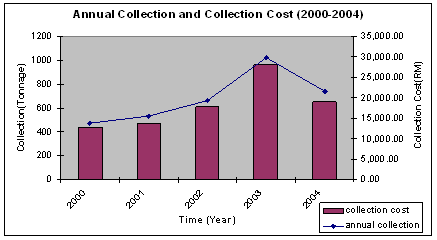
Figure 1: Annual Collection Volume and the Cost of Collection (2000-2004)
Trendline for Annual Collection
The trendline for annual collection of solid waste in Batu River is shown in Figure 2. From the data collected and analyzed, the best fitting line that can present the data is given by y = 415.74 x 0.3855.From the equation, we can forecast the collection of the solid waste for the next 5 or 10 years. It is expected that in the year 2010, the volume of solid waste that will be collected in Batu River is about 1010.0 tones per year.
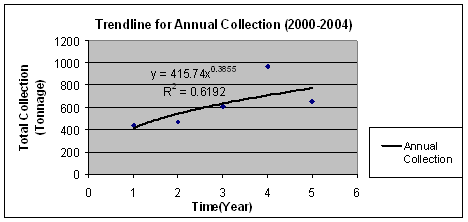
Figure 2: Trendline for Annual Collection Year 2000-2004
Trendline for Annual Collection Cost
The trendline for annual collection cost of solid waste in Batu River is shown in Figure 3. From the data collected and analyzed, the best fitting line that can present the data is given by y = 13145 x 0.3979.From the equation, we can forecast the collection of the solid waste for the next 5 or 10 years. It is expected that in the year 2010, the cost of collection of solid waste for Batu River is about RM 32 859.47 per year.
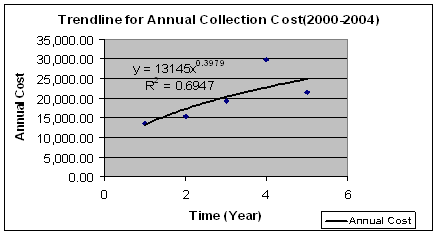
Figure 3: Trendline for Annual Collection Cost Year 2000-2004
MONTHLY COLLECTION
The collection trends for in figure 4 and 5 shown the increasing value during rainy season which start from November till March. Average collection for dry day in 2000 is 14.44 tonnes and compared to wet collection is 22.03 tonnes. The collection cost increased to 69 % from dry day. Average monthly collection is 36 tonnes and average cost collection monthly is RM1144.65.
The wet collections were increased 76 % from dry collections. And the increment of collection will also increase the cost collection by RM329.89.
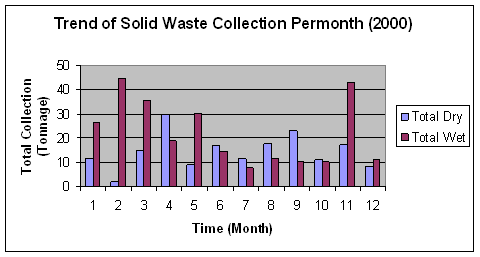
Figure 4a: Trend of Solid Waste Collection Permonth (2000)
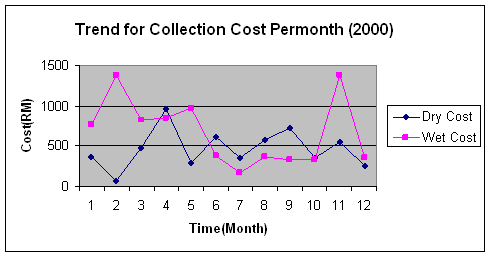
Figure 4b: Trend of Solid Waste Collection Cost Permonth (2000)
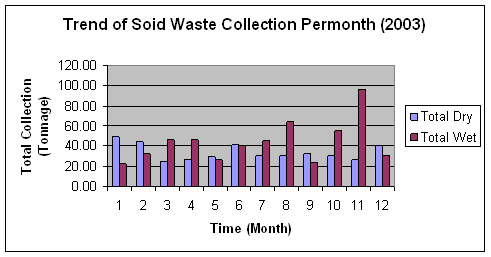
Figure 5a: Trend of Solid Waste Collection Permonth (2003)
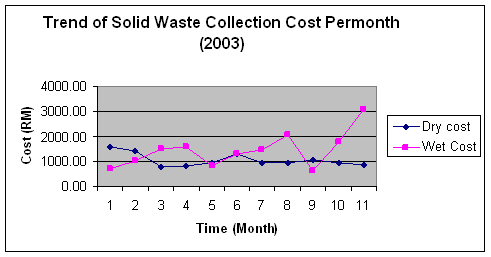
Figure 5ba: Trend of Solid Waste Collection Cost Permonth (2003)
CONCLUSION
From the data collected and analyzed work for solid waste collected at Batu River, the trend of the volume of solid waste collected and the cost are determined. The trendline for annual collection of solid waste in Batu River is given by y = 415.74 x 0.3855 and the trendline for annual collection cost is given by y = 13145 x 0.3979.From the equation, we can forecast the collection and the cost of the solid waste collected for the next 5 or 10 years. It is expected that in the year 2010, the volume of solid waste that will be collected in Batu River is about 1010.0 tones per year with the cost about RM 32 859.47.
Climatic changes and land use changes is the vital factors to consider in planning for solid waste management in urban river.
We can reduce this figure by educating the public about the environmental awareness. We should have a program which is aimed at educating the general public and raising awareness with respect to preservation and conservation of rivers and its environment. Special attention is given to those living the vicinity of the rivers including squatter’s areas.