Figures from higuchi_original.for and alsop_original.for program
A. Figures for Higuchi Model (Old results without consideration of lateral averaging)

A.1 Well, ignore the serrated pattern. I computed the high precision results late, and the results just came out a few minutes, and just as I was about to plot them, MATLAB gives some sort of error. Sorry, but let me upload them later......

A.2 Well, I did not know what depth would produce only 3 modes, so I just moved the depth of layer 1 to 150 km, and I got 6 modes. They look good, excep that I computed the high precision results late, and the results just came out a few minutes, and just as I was about to plot them, MATLAB gives some sort of error. Sorry, but let me upload them later......
B. Figures for Alsop and Higuchi Model (with laterally-averaging)
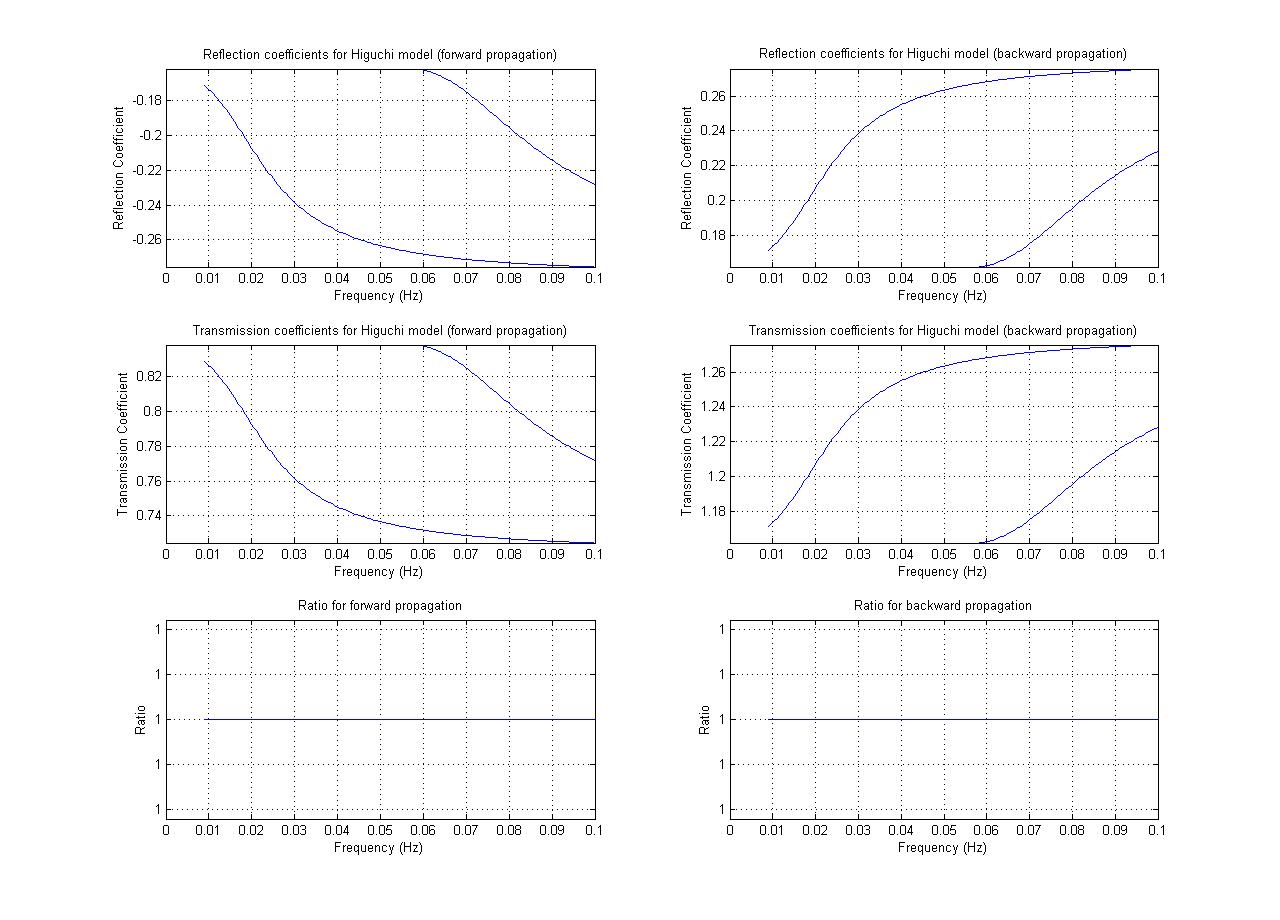
B.1 These are the final results from HIGUCHI_ORIGINAL.FOR .

B.2 These are the final results from ALSOP_ORIGINAL.FOR .
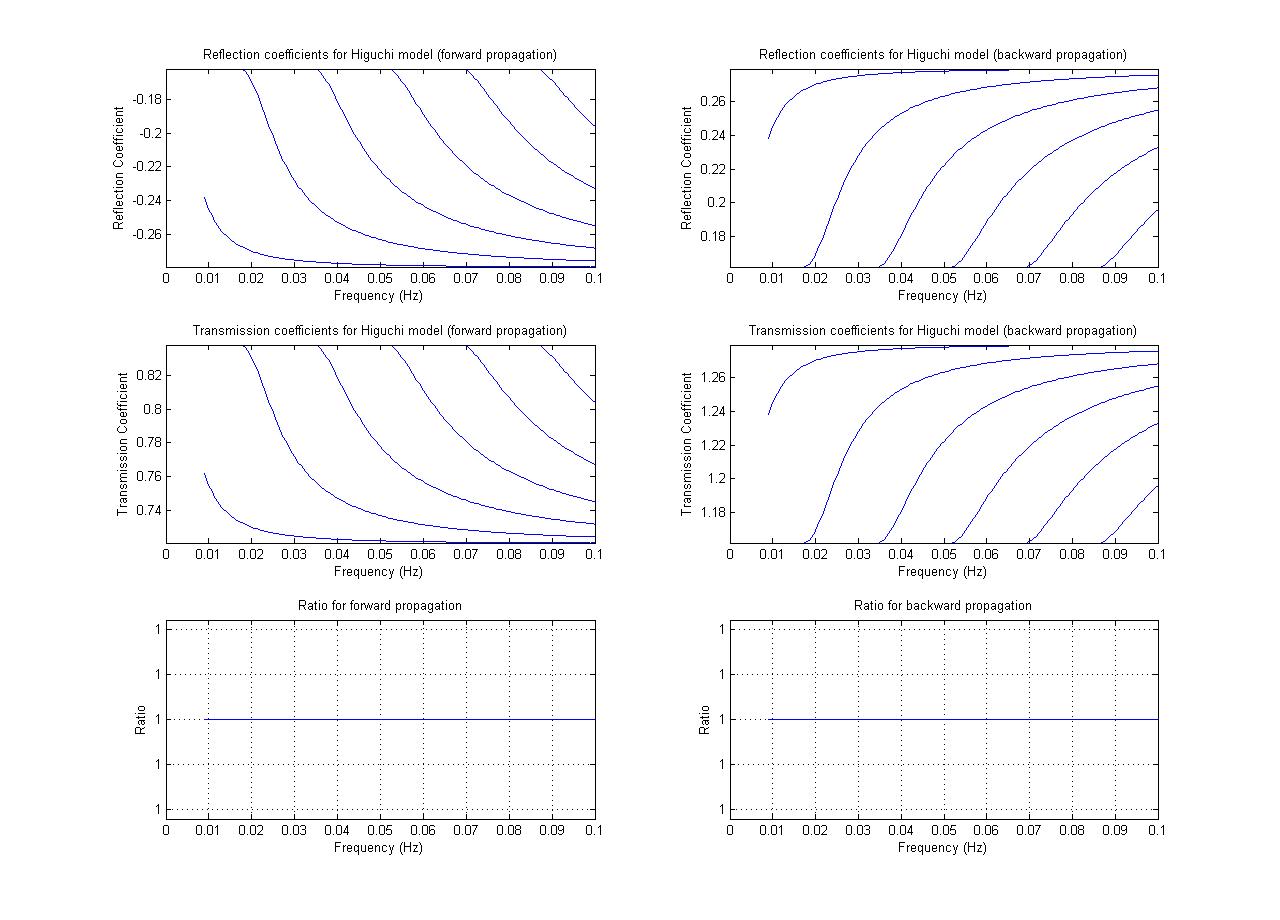
B.3 Higuchi model with depth of top layer at 150 km.
C. Test at a single Lat-long location with Alsop's Fig 13

C.1 This was computed using ALSOP_ORIGINAL.FOR . At the vertical plane x = 0 , I use the \mu from the true structure that is present on the left and right, i.e.
FTRUE_FIG_13_LEFT.DAT and FTRUE_FIG_13_RIGHT.DAT . The structure on the left and right of the x = 0 plane are the same
laterally-averaged structure. For our testing purpose, I used
FUNDA_FIG_13_LEFT.DAT
and
FUNDA_FIG_13_RIGHT.DAT