
Correlation between Michlet and real world tests
What does the bulb on the bow of a ship do?
Resistance curves of WW1 and WW2 warships
The speed of a ship is controlled by at least the following parameters:
I'm leaving 3,4 and 5 out of it for the time being. (1) is discussed in Eugene Grissel's page at ....
http://www.dynagen.co.za/eugene/hulls/(6) is presumably trivial for most ships.
The wave-making drag (2) has historically been very difficult to analyse for real hulls, and is not straightforward even for mathematically simple shapes. But now we can estimate it fairly accurately.
Hit this link to skip the maths and get to the exciting stuff
An Australian mathematician called Michell proposed an equation late in the 19th century. He effectively modelled
the hull as an array of volumetric sources and sinks. This equation was generally ignored until it was republished
by Havelock. It was still too difficult to solve for most cases.
Much later Castles proposed a simplification. He proposed modelling a longitudinally and laterally symmetrical
hull as a single source and a single sink. These were separated by the length Cp.L, and of strength sigma*U (defined
below). Effectively the bow displaces a lump of water, thereby generating a set of waves. In isolation these would
probably consist of a mixture of every wavelength . A little later the stern comes along and generates a negative
wave set of the same amplitude and shape. The interactions between these two sets of waves, governed by the speed
of the ship and its length, allows all these different wavelengths to constructively or destructively interfere.
The pattern we see is where no cancellation has occurred. The energy required to create these waves is the cause
of the wave-making resistance.
I found this numerical solution in an excellent book: High Speed Sailing by Joseph Norwood. The Castles approach
results in an equation that is solvable, even if it still looks rather scary:
The Cw equation has 3 important parts - an oscillating term of 1-cos(x) , which gives the humps at various speeds,the
x2/root(...) bit, which ramps it up a bit with x, and the exponent which rapidly zeroes the whole thing
out at higher values of x. When x hits 100 or so, typically, that exponent kills any further contribution to the
integral. If you type that into Mathcad then it won't work, unfortunately. However, with a bit of fine tuning it
can be forced to solve the messy looking integral- hint infinity is fairly small. It takes a while to do so. Rwv
is the Wave resistance due to the pair of sources and sinks at a given speed U.
I was most of the way through writing a program to solve this when I discovered this excellent web site:
Link to Leo's site This has links (under 'Personal') to his excellent DOS based program Michlet. Alternatively try this link which sometimes has a free demo version available, and at which you can buy the full version.
Michlet solves the full wave resistance equation, not Castles' simplified form. He also has incorporated
skin friction and eddy loss estimates, so it solves most of 1,2 and 7. Unfortunately you have to enter the trim
by hand, which is a bit tricky. The trim is the amount that the bow and the stern rises or falls, which varies
with speed.
Here's a comparison between a tank test of a 1/25th scale model of a destroyer, and the results as calculated by Michlet
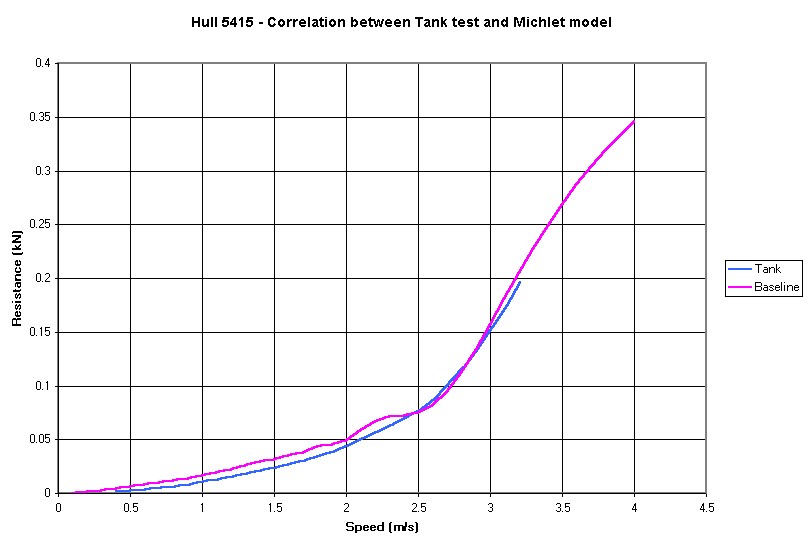
Unfortunately the tank data stops just as things are getting interesting, but you'll probably agree that the correlation
is acceptable. Due to a bad case of programming burn-out I used a very nasty spreadsheet to generate the hull-form,
so with a bit more care the fit might improve. Leo's
included more correlation work in his program's zip file. There's no trim data in this or any of the runs.
The hump at 2.3 m/s is the P2 hump, where two waves fit into the hull length. 1.8 m/s is the P3 hump. The P1 hump causes the rapid increase in resistance above 3 m/s, for this hull it peaks at around 3.3 m/s. I've noticed on a few graphs that Michell/Havelock's approach often seems to overemphasise the height of the P2 and P3 bumps, and correlates better at the P1.5 and P2.5 dips.
Incidentally , full size boat speed is 5x the model speed, and knots are double the m/s. So this model hull would have an expected 'yachties hull speed' of 2.7 m/s (27 knots for the real ship), which doesn't really correlate with any obvious feature on the resistance curve. There again the hull isn't much like a yacht's.
Download the input file here This gives the in.mlt file for the Michlet run. It is much better than the file shown below.
Somebody on the totally excellent www.warships1.com board asked this. Here's an answer.
Here's the waterlines (horizontal sections through the hull) and the vertical sections. They are not to scale (Michlet rescales the width to get the correct displacement). Michlet assumes that the hull sections given are fully immersed, so this is the bit of the hull actually in the water. These are all equally spaced.

The bit at the bottom is the sonar dome. The blue lines in the waterline, and the heavy black line in the section, shows the bulb I added. This was about the best I could get for 2 m/s (or 20 knots on the real ship, ie a good cruising speed).

The baseline hull in this graph is NOT the hull used for correlation above. The effect is an improvement of 2%
at low speed, 6% or so at high speeds, and 10% at some speeds, with no real disadvantages at all. This would reduce
the fuel consumption by 6% at typical speeds, and increase the top speed by 2%, or half a knot.
If the diameter of the bulb is reduced it has to be raised higher, and it is less effective. It is very easy to increase the resistance by putting the bulb in the wrong place.
The next question is, well how does it work? The answer is, I don't really know, but if you look at the Pn humps they are much shallower. My guess is that the bulb is detuning the length of the ship, so the harmonic wave structure has a lower Q. This sounds like a good thing for reasons I can't quantify (except to say that since the resistance peaks at Pn, it is obviously a bad thing to have the wavelength coincident with the the hull). This is effectively reducing the impedance matching between the hull and the water's surface. An argument in favour of that is that a rectangular block has very strong Pn>1 peaks, and it obviously offers the best possible hope for a wave to 'lock on' to the hull.
Here's the waveplots for the baseline, and the modified hull, at around 2 m/s (bad choice of speed - I should have chosen one where the effect of the bulb was more pronounced):

The vertical bar is an aberration, these plots don't mean anything much in the vicinity of the hull.
The maximum wave amplitude is 0.097 m
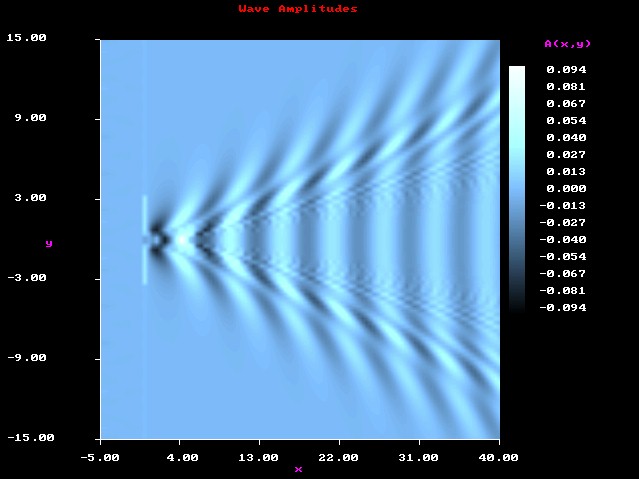
The wave amplitude has dropped by 3%. The energy per unit width in a wave is proportional to its wavelength * height
squared, so if the wave height reduces by 3% then the energy should drop by 6%... a bit too neat! It would be nice
to think that the reduced chequerboard pattern inside of the V had something to do with the reduced resistance,
but bear in mind that there is very little energy in small short wavelength waves. Looking at some other plots
there is often a difference in the way that the two outer sets of waves interact along the break line at about
20 degrees from the hull.
Incidentally I tried knocking the sonar dome off. That increased the drag by 2% or so, indicating (obviously) that
the hull shape had already been optimised around the sonar dome. You obviously wouldn't use a bulb on this ship
as the increased flow speed around the dome would negate the primary purpose of the destroyer.

I'd really like to work this stuff out for USN Enterprise and USN Iowa. Does anybody have the hull sections (in any form, but an ascii file of x,y,z coordinates would be nicest) for these ships?