 Lake & Watershed Resource Management Associates
LWRMA
@megalink.net
Report on the Health of
2008
Baseline water
quality monitoring was conducted for
Overall,
Lakes and ponds may
experience a significant amount of variability from season to season and year
to year. In addition to the influences of human activity on lake health (water
quality), annual variations in the weather can have a significant effect on
indicators of lake water quality. The weather during the 2008 monitoring season
was extreme throughout much of the State of
The 2007 water
clarity (transparency) average for Great Moose was 4.3 meters at the deep
station (01), compared to 4.9 meters in 2007, 4.5 meters in 2006, 4.3 meters in
2005, 5.3 meters in 2004, and the historical average of 4.5 meters for the
station.
Water clarity at
station 02 averaged 4.8 meters, compared to 5. 2 meters in 2007, 5.0 meters in
2006, 4.4 meters in 2005, 5.3 meters in 2004, and the historical average of 4.8
meters at this station.
Water clarity
(Secchi transparency) is one of three primary indicators of the biological
productivity of lake ecosystems, in addition to the nutrient phosphorus (TP)
and chlorophyll a (CHL), a pigment that is used to measure the
concentration of algae in lake water.
The 2008 average
total phosphorus (TP) level for station 01 was 13 parts per billion, compared
to 9 parts per billion in 2007, 13 ppb in 2006, and the historical average of 9
ppb. The July TP concentration measured 12 ppb, and the August sample measured
13 ppb.
The station 02
average was 16 ppb, compared to 10 ppb in 2006 and the historical average of 10
ppb for that area of the lake, based on the July sample concentration of 25
ppb, and 11 ppb in August. The unusually high phosphorus concentration in July
cannot readily be explained. It is significantly higher than any previous
single sample that has been taken in the lake. Phosphorus samples are easily
contaminated with nearly any organic matter that may be in the water, including
clusters of algal cells and other material that is extremely fine and difficult
to detect visually. It is possible that suspended organic matter in the lake
may have been captured in the core sample, causing the elevated reading. The
fact that the August sample measured less than one half the concentration of
the July sample, and that the chlorophyll-a (algae) sample from July was lower
than the July sample is cause to suspect sample contamination.
A TP sample taken in
August near the bottom sediments at the deepest point in station 01 measured 11
ppb, and a similar sample taken at station 02 in August measured 17 ppb. The
sample taken at station 01 was close in concentration to the phosphorus sample
taken near the surface. However, the bottom sample taken at station 02 was 6
ppb higher than the surface sample. The higher concentrations of phosphorus
near the bottom may have been associated with very low dissolved oxygen levels
at the time at both stations. Historical bottom grab samples taken during the
late summer have also been relatively high, indicating that low oxygen levels
may be playing a role in the release of phosphorus from the bottom sediments.
This phenomenon bears watching in the future, because low concentrations of
oxygen in the water during the summer, along with indications that phosphorus
is being released from the sediments could result in an overall negative impact
on water quality under certain circumstances.
The 2008
chlorophyll-a average for station 01 was 7.0, compared to 4.0 ppb in 2007, 4.2
ppb in 2006 and the historical average of 4.3 ppb at this station. The station
02 average was 4.5 ppb, compared to 3.5 ppb in 2007, 4.0 ppb in 2006 and the
historical average at this station, 4.0 ppb. The substantially higher than
average level at station 01 was largely the result of a high value (8.7 ppb) in
July. The water was less clear at the deep station on that day, but even so,
the CHL level was unusually high, compared to the level at station 02.
Dissolved oxygen
profiles taken in July and August were similar to those from the past several
years. Moderate oxygen depression (less than 5.0 ppm) and some depletion (less
than 1-2 ppm) was documented in the deepest several meters of water at station
01 in August, similar to historical conditions documented in this region of the
lake. Severe oxygen depletion was documented
at Station 02 in August, with virtually no oxygen found below 7 meters depth.
The August, 2008 oxygen profile was similar to ones documented at station 02
for several of the preceding years.
Additional water
quality indicators monitored in 200 (pH, total alkalinity, water color) were
within normal limits for
Discrepancies
between samples taken at the two stations in 2008, and between the two sampling
dates, as well as departures from historical averages for both stations are
likely to have been related to the unusual weather during the sampling season.
The August 15 visit to the lake followed nearly two weeks of severe rain, which
undoubtedly resulted in the flushing of watershed wetlands, as well as moderate
runoff from roads, rooftops, lawns and agricultural land. Sediment from soil
erosion, phosphorus from sediment particles, fertilizers and human and animal
waste may have skewed some samples.
Statewide Perspective on 2008
To put into
perspective the significance of the 2008 water clarity findings, consider that
out of 418
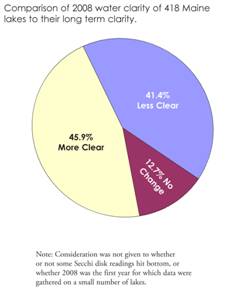
Percentage of
It is likely that
the reduction in the number of lakes that were clearer than average in 2008 was
the result of heavy snow and runoff in the spring and moderate to severe rain
throughout much of Maine during the mid to late summer period. Spring runoff
from melting snow and rain typically carries a high percentage of the annual
phosphorus load to lakes from their watersheds. Information obtained from the
National Weather service indicated that
Water clarity is one
of three primary indicators of the overall biological productivity of lake
ecosystems, in addition to the nutrient phosphorus (TP) and chlorophyll a
(CHL), a pigment that is used to measure the concentration of algae in lake
water. The three indicators, along with dissolved oxygen, are considered to be
key measures of the water quality, and overall health of
The chart below
shows the extent to which water clarity (Secchi transparency) has varied for
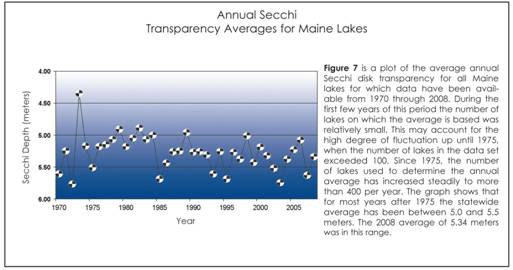
Source:
The illustration above shows that for the period from
2004-2006, the “average” clarity of
The graph shows that a number of similar changes have occurred historically. Some of the “clearest” years have been those during which drought has recently occurred, such as 1985 and 2002 and 2003, which followed the severe statewide drought of 2001.
Each lake and pond responds in a unique way to the
influences of weather, changes in land use in the watershed, and other forces
upon the ecosystem. That is because of the wide range of physical, chemical and
biological characteristics of each lake basin and its watershed. Most lakes and ponds experience moderate
levels of natural annual variability.
Water clarity
(Secchi transparency) is one of four primary indicators of the biological
productivity of lake ecosystems, in addition to the nutrient phosphorus (TP),
chlorophyll a (CHL), a plant pigment used to measure of the
concentration of algae in lake water, and the concentration of dissolved oxygen
in deep areas of the lake during the summer months.
Prepared by Scott Williams, Aquatic Biologist