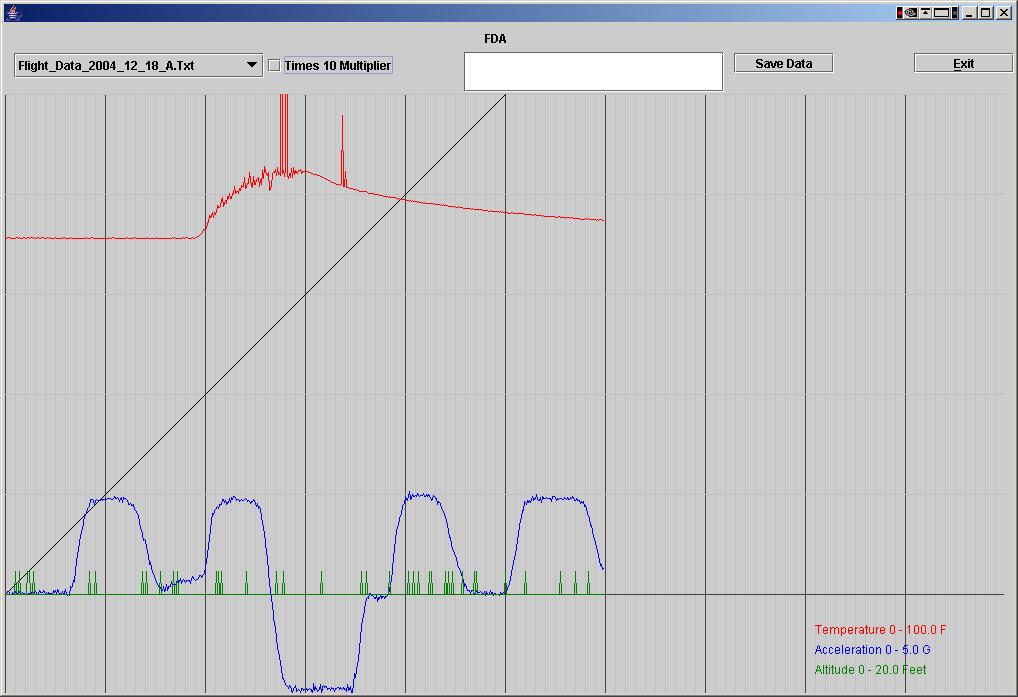
Here I had everything on one screen. It is displaying the first real data I got back from the Motherboard on the workbench.
- The Red line is Temperature Data; I held the Temperature Sensor in my hand until it warmed up a bit, and then let it cool off to room temperature again. The glitches are because the Temperature Sensor was connected with Clip Leads.
- The Blue line is Acceleration Data; I turned the Motherboard upright to read +1G of Acceleration (measuring earth's gravity,) held it level to read (approximately) 0G, and held it upside down (or is that downside up?) to read -1G of Acceleration.
- The Green Line is Altitude Data; since it is only sensitive to about 30 foot increments (due to steps of the 10 Bit ADC) and it was impractical to raise and lower my workbench by 30 feet, all I can see is some jitter.

Here I have split each new graph to a new window so they can be easily compared. This is the first indication that the EEPROM is going bad! All four of these should have different data. Note the similarities between them, with only a small portion of the data being saved correctly to the EEPROM. From this point on, I could no longer save any new programs to the EEPROM