
"Give 'Em the 'Ole Razzle Dazzle, Razzle Dazzle Them! Give 'Em an Act With Lots of Flash In It and the Reaction Will Be Passionate!"
*Review some vocabulary vital to graphing*
m = slope of the line
b = y-intercept
y axis = vertical axis
Your Case:
Solve this linear equation by graphing:
x + y = -7
-2x + y = 2
First, you must place the equations in slope-intercept form, which is y = mx + b
1st equation:
x + y = -7 *Original Problem*
y = -x -7 *Subtract "x" from both sides*
2nd equation:
-2x + y = 2 *Original Problem*
y = -2x + 2 *Add 2x to both sides*
Now that you have your equations in slope-intercept form, you are ready to graph.
First, you should identify your y-intercepts for each problem.
For the first equation, your y-intercept is -7.
So, start at -7 on the y axis, and since your slope is -1/1, you move down one point on the y axis and over positive one; or you can go up positive one and over negative one. Once you have done this several times, your line should appear like this:
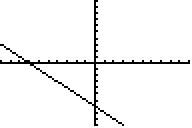
Now, identify your y-intercept of your second equation which is +2. Since your slope is -2/1, you move down two points and over positive one; or you can move up positive two and over negative two. After you repeat this several times, your line should appear like this:
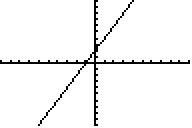
On your calculator or your graph paper, the two will have a defined interception point for your solution. On a graphing calculator, you can hit *Trace*, *5*, *Enter, Enter, Enter*. The point will appear on your screen. Your graph's final product should appear like this:
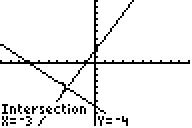
Congratulations! You have just won your case!
"Razzle Dazzle Them, And They'll Beg You For More!"