|
|
Graphing Linear Equation
Basicly graphing equations is one of the more simplistic and easiest ways to these equations. All you have to due is make sure your equation is in slope-intercept form and put that into your Y= portion on the calculator and then graph. How simple can anything get.
There are 3 types of graphs that can show up depending upon the equation.
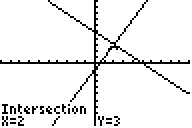
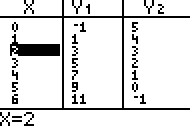
1. POINT OF INTERSECTION, 2 lines that intersect
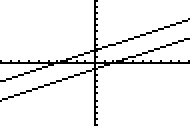
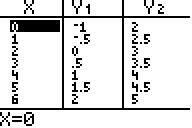
2. PARALLEL LINES,2 lines that never intersect
3. INFINITE SOLUTIONS, 1 line with neverending solutions
-2x+y=-1
x+y=5
Take and turn into slope-intercept, put into calculator, and graph. Next find the point of intersection if there is one.
|
|
y=(1/2)x-1
y=(1/2)x+2
It looks like it could be parallel or does it. Well lets find out plug it into the calculator and graph. Tell if there is a point of intersection or not.
|
|
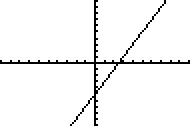
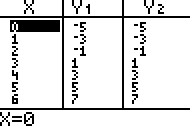
2x-y=5
-4x+2y=-10
Slope- intersept this bad boy, plug it in, and graph it. Does it have a point of intersection if not that means it is either parallel or just 1 line.
|
|