We will run through some basic forecasting concepts before we dive in to EXCEL forecasting. These concepts are essential when we do forecasting.
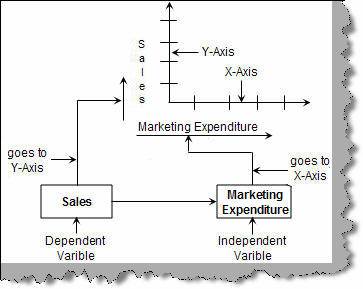
Forecasting means trying to visualize future prospects using current and history data. Any forecasting has two things one is the dependent variable and other is independent variable. Dependent variable are what we want to forecast and independent is on which basis we will be forecasting. For instance consider the below figure 'Dependent and Independent' where we want to predict sales (dependent variable) for a given marketing expenditure (Independent Variable). Some of the conclusions we can make from the figure is:-
Figure: - Dependent and Independent
Forecasting is all about finding the relationship between dependent and independent variable. There are many scientific ways of finding the relationship one of them is using ‘Regression Analysis’. Regression analysis is a technique which describes relationship between two variables. There are different types of regression analysis available depending on the data:-
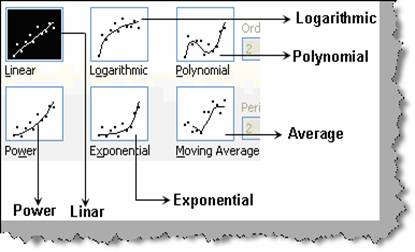
Figure: - Regression types
The above points are true if we have to find relationship and forecast on the basis of one or more set of data. Let’s say if you want to find out how the sales performed on the basis of marketing expenditure and quality of product. That means you have multiple independent variable. For this scenario we can use multiple regression fundamental.
So let’s summarize what we have understood regarding forecasting:-
Note: - Now that we know the basic lets try to implement the above forecasting regression fundamentals in EXCEL.