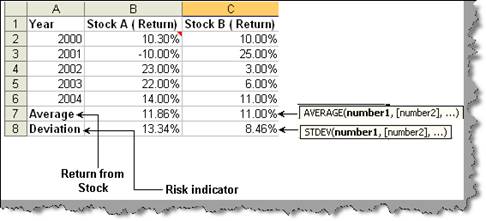
There are two important things which need to be considered while making decision between stocks. First is how much return the stocks will give and second is the amount of risk associated with the stock. So when we want to compare any two stocks we should first find these two values. To compare two stocks we also need to have history for the same. Below figure ‘Stdev in action’ shows two stocks (stock A and stock B) with rate of return every year. The first thing we need to find is which stock gives us good return on an average. So using the ‘average’ formula we have found out that Stock A gives us good return than Stock B. As said previously rate of return should not be the only criteria for evaluating that we need to buy the stock or not we also need to find out how much percentage risk is associated with the stock.
If the stock is volatile it has higher risk. So if we are able to find out how much the stock varies we can measure the volatility of the same. The best way to find volatility is by measuring how much is the standard deviation in the stock. Standard deviation is a measure of how widely and far are the values spread. So if the values are spread too far that means there is high level of volatility. We have used ‘stdev’ formula to calculate standard deviation. ‘stdev’ takes range of values and calculates the deviation according to the spread. From the results we can see that deviation of Stock A is more than Stock B. So Stock A has high level of risk than Stock B.
Now which you choose completely depends on personal judgment. My call on this is Stock B. Its worth to leave the 0.86% of profit than taking 5% extra risk.
Figure: - STDEV in action
Now let’s see the magic of diversification. Let’s invest 50% in stock A and 50% in stock B. So you can see from the figure ‘Diversified Investment’ we have multiplied both the stock value by 0.5 i.e 50% investment. By doing this we are getting 11.43% returns with only taking 2.6% risk. That’s the power of diversified investment. We have almost brought down our risk 1/4th time.
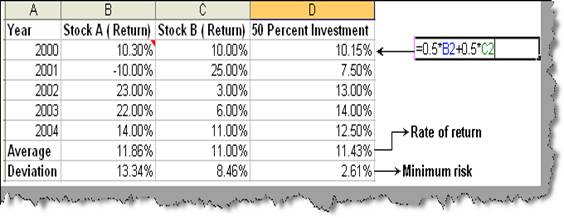
Figure: - Diversified investment