First let’s try to understand what is depreciation all about ?. Any asset we buy for an organization has a finite life time. As time passes by asset looses value. It helps us to evaluate the wear and tear for fixed assets over a period of time.
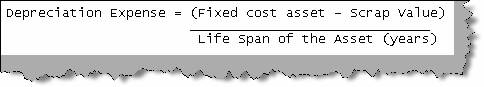
Straight line depreciation is the simplest and widely used technique. Below figure ‘straight line depreciation’ shows the complete formula for the same. Fixed cost asset is the total cost of the asset. Scrap value is the asset value when it will be finally sold or disposed. For instance let’s say you have bought a computer and you use it for 5 years. Even after five years the computer will still sell for some amount. There is a possibility depending on asset that the scrap value can be zero. Life span of the asset is the total life time of the asset.
Figure: - Straight line depreciation
To calculate straight line depreciation we need to use the ‘SLN’ formulae. It takes three values the fixed cost which is termed as cost in excel , scrap value also called as salvage value and the life of the asset. This returns us depreciation calculation per month.
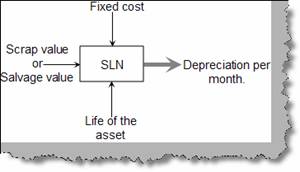
Figure: - SLN in action
Let’s try to understand the same with a simple formula. In the below figure ‘SLN formulae in action’ we can see, we have defined a fixed cost, scrap value and life in years. On the right hand side you can see how a ‘SLN’ formula takes those inputs. In the same figure we have also shown the output for the same. If you try calculating using ‘Straight line depreciation’ formulae discussed previously you should arrive to the same answer.
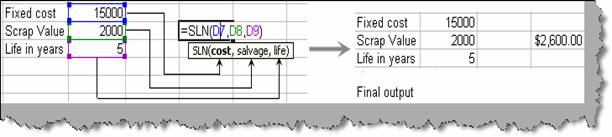
Figure: - SLN formulae in action
First thing to note is that the depreciation is calculated yearly for this example. Now if we spread the depreciation for five year (which is the life span of the asset) you will get a balance of 2000. This balance is nothing but the scrap value of the asset. Below table ‘Final depreciation calculation’ shows how the values are spread for five years, the total depreciation and the balance left.
|
Years |
First year |
Second Year |
Third Year |
Fourth Year |
Fifth Year |
|
Depreciation Value |
2600 |
2600 |
2600 |
2600 |
2600 |
|
Total Depreciation |
13000 |
||||
|
Balance |
2000 |
||||
Table: - Final depreciation calculation