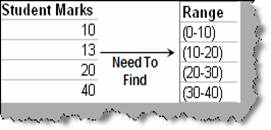
First let’s try to understand the above problem with a sample scenario. Consider the below scenario where we have marks of students and we need to find out how many students fall the range specified in figure ‘Students marks’.
Figure: - Students marks
This can be achieved using the ‘FREQUENCY’ formula. Please note ‘FREQUENCY’ is an array formula. In the below figure ‘FREQUENCY in action’ we have shown the inputs needed by the frequency formula. It takes two inputs one is the data and the other is range in which we want the counts. In our example the data is the student’s marks and the other input is the range column. As said previously ‘FREQUENCY’ gives back array of output so we need to select the range of column where output will be displayed and press SHIFT + CNTRL + ENTER.
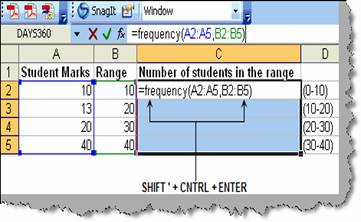
Figure: - FREQUENCY in action
Once done you should see the output as shown in figure ‘Output from FREQUENCY’.
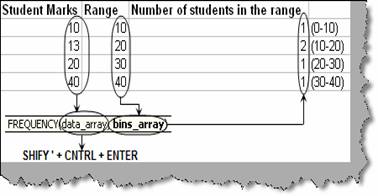
Figure: - Output from FREQUENCY