Let’s try to understand the concept of multiple regression. Let’s consider the same sample of the sales forecasting considered in the previous example. We have done two regression analysis one of for sales and marketing expenses and second is between sales and salary rise. Now lets we have a scenario where we want to predict sales on the basis of marketing expenditure and salary rise. In short we need to predict the dependent variable on the basis of two independent variables.
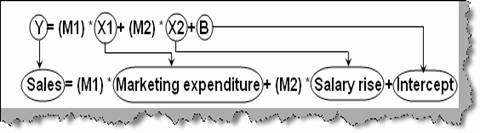
We can do multiple regression using the data regression tool provided by EXCEL. The normal formula for multiple regression is as shown in the below figure ‘Multiple regression formulae’. As we have two independent variables we have designated the same with ‘M1 and X1’ and ‘M2 and X2’ plus the intercept value. The same we have mapped with sales, marketing expenditure and salary rise.
Figure: - Multiple regression formulae
To find the relationship between two independent variables we need to use the data regression tool discussed in the previous questions. All the other steps remain same except for the input X range value. The input X range selection will be of two columns (i.e. marketing expenditure and employee salary rise) as shown in figure ‘Multiple regression using tool’.
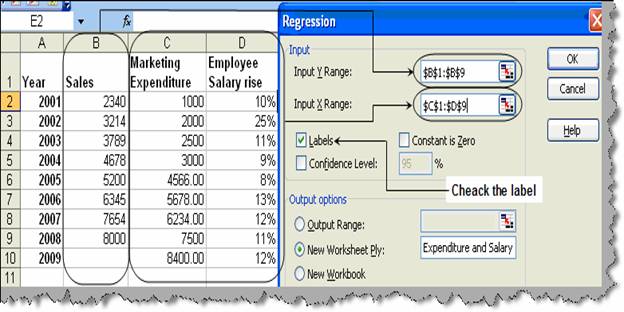
Figure: - Multiple regression using tool
Once you run the tool you can see a regression analysis output as shown in the below figure ‘Formula mapped to regression sheet’. As we had selected two inputs in the ‘X’ range we have two slopes one for ‘Marketing expenditure’ and the other for ‘Employee salary rise’. Using these two values we can now establish the relationship equation between Sales and Marketing / employee salary rise.
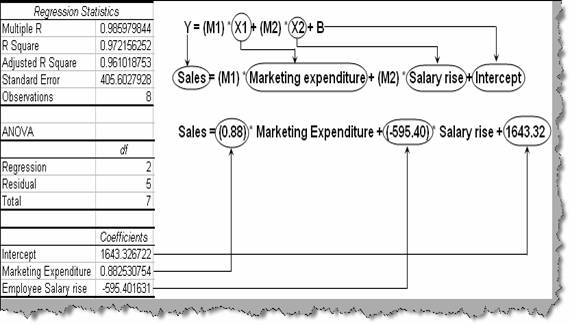
Figure: - Formula mapped to regression sheet