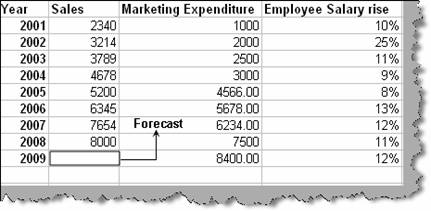
Let’s try to experiment the same using a small sample as shown below in figure ‘Forecasting sample’. We have three parameters sales, marketing expenditure and employee salary rise. We are interested in predicting the sales parameter. We want to know from the other two variables i.e. marketing expenditure and employee salary rise who makes the most impact on the sales figure. In short we need to analyze that by increasing salary does the sales increase or by increasing marketing expenditure does the sales increase.
Figure: - Forecasting sample
In case both of them are impacting the sales figure we would like to know who impacts the most. We would also like to forecast sales for marketing expenditure of 8400 and 12% of salary rise. So below are our goals which we would like to achieve:-
Note: - Please ensure that you have installed the analysis tool pak to ensure that we can do regression analysis using EXCEL.
So let’s start step by step.
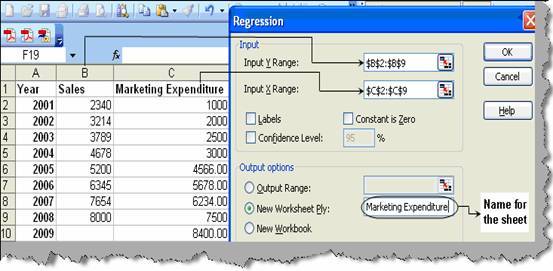
Figure: - Regression box
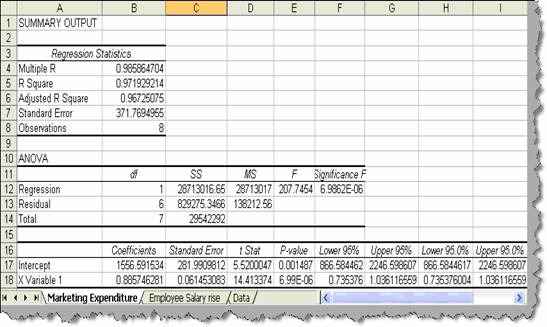
Figure: - New Sheet
The sheet generated by regression analysis must be looking pretty complex at the first glance. We will try to understand different factors which can help us make our judgment regarding forecasting. Before we proceed you can also generate regression analysis between employee salary and sales in the same fashion as we did for ‘Marketing expenditure’. This is needed to compare which independent variable makes more impact.
Below figure ‘Comparison’ shows both the linear regression analysis output. The ‘R square’ value gives us the correlation coefficient. In short it says how much are both data values related. More it’s near to ‘1’ more it has relation and more it is far from ‘1’ it has less relationship.
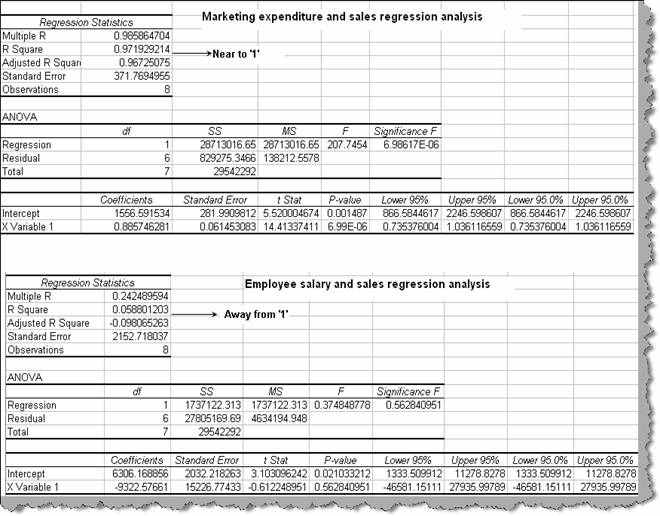
Figure: - Comparison
So from the above comparison we can easily make out that ‘sales’ has more tighter relationship with ‘marketing expenditure’ than ‘salary rise’. So let’s evaluate the relationship equation between ‘sales’ and ‘marketing expenditure’.
As this regression is a linear regression. It is very much related to linear expression which you learnt during your school days.
Y = M (X) + C
Below figure ‘Linear formula’ shows the relation between the formula and the sheet generated by regression analysis. The intercept forms the intercept value taken from the regression sheet. X variable is the slope or ‘M’ of the linear equation.
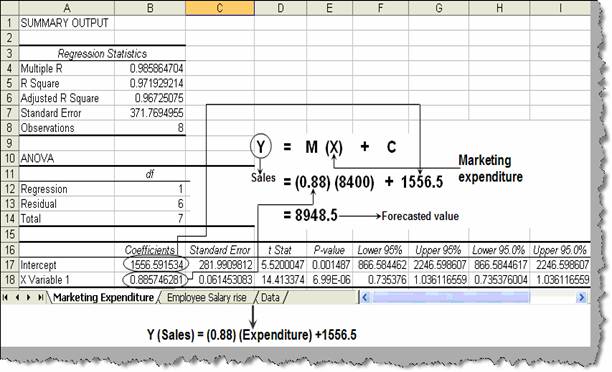
Figure: - Linear Formula
So using the regression output the final relationship between expenditure and sales is as shown below.
Sales = (0.88) (Marketing Expenditure) + 1556.5
Using the above equation we can forecast sales for any give ‘Marketing expenditure’. We can also find the ‘intercept’ , ‘slope’ and ‘R square value’ separately by using ‘intercept’,’ slope’ and ‘RSQ’ formula . Below figure ‘Intercept, slope and RSQ in action’ shows the same in a more detailed manner.
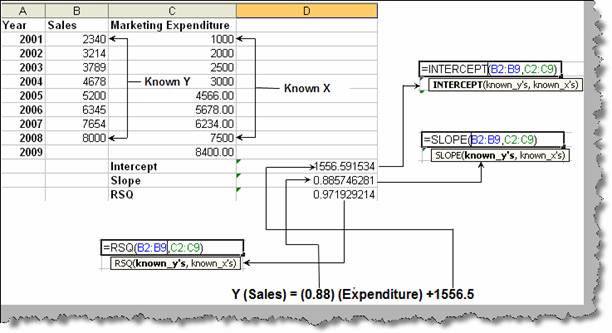
Figure: - Intercept, slope and RSQ in action