First let’s try to understand this question. In the below example ‘Stock diversification sample’ we have three stocks ‘Stock A’,’ Stock B’ and ‘Stock C’. You have decided to buy ‘Stock A’. Now you want to buy either ‘Stock B’ or ‘Stock C’ in such way that it should give you diversified portfolio. In short you want to find out which stock from ‘B’ and ‘C’ has no relation or least relation with ‘Stock A’. This can be achieved by using the ‘CORREL’ function. ‘CORREL’ takes two collection of values (in this case it is the stock values) and gives you a number between 1 to -1.
|
Value |
What does it mean? |
|
More the value near to ‘1’ |
This means both the value are related. So more near to ‘1’ more is the relationship. |
|
More the value near to ‘-1’ |
This means both the values are not related. So more near to -1 more independent are the value. |
Table: - CORREL values
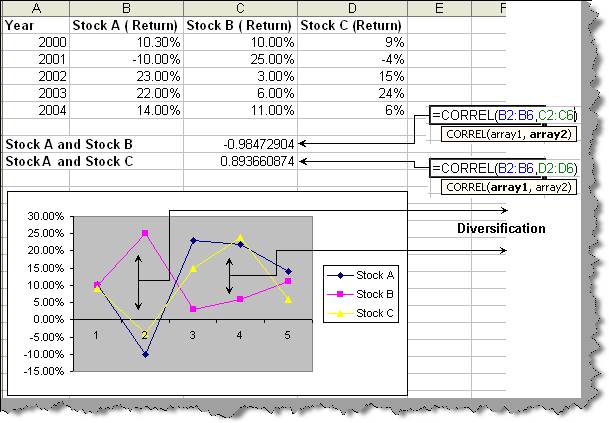
So using the ‘CORREL’ function we get that stock A and stock B have a value of ‘-0.98’ and for stock A and C we have value of ‘0.89’. So stock A and stock B are more diversified than Stock A and Stock C.
Figure: - Stock diversification sample