%%evrFig2.m
%%evrFig2.m
%%%%%%%%%%%%%%%%%%%%%%%%%%%%%%%%%%%%%%%%%%%%%%%%%%%%%%%%%
%%%From [email protected] Thu Jul 10 14:59:51 2003
%%%Date: Thu, 10 Jul 2003 14:59:42 -0700 (PDT)
%%%From: evr ([email protected])
%%%To: "Allen, Rob" ([email protected])
%%%Cc: E. Chan ([email protected])
%%%Subject: RE: batch converting spe to tiff
%%%Subject: SPEfiles2Matlab.m
%%%~~~~~~~~~~~~~~~~~~~~~~~~~~~~
%%reads Princeton camera *.SPE files -> Matlab
%% comments -> [email protected]
%%use at your own risk, may contain errors
%fid=fopen('nameOfFile.SPE','r');
%header=fread(fid,2050,'uint16');%4100bytes/2
%ImMat=fread(fid,1024*1024,'uint16');
%Z=reshape(ImMat,1024,1024);
%fclose(fid);
%Z=double(Z);
%[X,Y]=meshgrid(1:1024,1:1024);
%mesh(X,Y,Z); %display 3D
%%
%%%~~~~~~~~~~~~~~~~~~~~~~~~~~~~~~~~~~~~
%%%On Wed, 9 Jul 2003, Allen, Rob wrote:
%%%> can you tell me how you were able to do this,
%%%> so that i will be %%%able to help others with
%%%> the same question? thanks.
%%%>
%%%> > -----Original Message-----
%%%> > From: evr [mailto:[email protected]]
%%%> > Sent: Tuesday, July 08, 2003 10:07 PM
%%%> > To: Allen, Rob
%%%> > Cc: E. Chan
%%%> > Subject: Re: batch converting spe to tiff
%%%> >
%%%> >
%%%> >
%%%> >
%%%> > Thanks for all your advice. We can read the spe file into
%%% Matlab.
%%%> >
%%%> >
%%%>
%% this program is free (for non-commercial use)
%%%evrFig2.m
%%makes evrFig2.jpg and eps using subplot
%%%from old figures 4,5,25 and 26
%%==============================
%%make bigger font,darker line default
set(0,'DefaultAxesFontSize',10);
set(0,'DefaultAxesLinewidth',2);
set(0,'DefaultTextFontSize',10);
set(0,'DefaultLineLinewidth',2);
set(0,'DefaultAxesPosition',[0.15 0.2 0.7 0.6]);
%%%%LineShape.m
%%I am willing to help you customize
%%this program for your needs. Enjoy!
%%send email [email protected]
%%%%LineShape.m
%%%
%%change inSPE==350 to whatever you need in the list
%%of filenum and you can also change filenum.
%%Some of the stuff in this program is junk or
%%redundant but I'm afraid to remove it will
%%%introduce some errors so I'm leaving the
%%dirt along with the good stuff(has not been
%%commented out but lies within the if inSPE==
%% ...end%inSPE) . THere is also some good stuff
%%that has been commented out. So before you mess
%%with it, save a copy of the original.
%% email me (evrATu.washington.edu)for help
clear;
%%%%%%%%%%%%%%%%%%%%%%%%%%%%%
%%%%%%%%%%%%%%%%%%%%%%%%%%timing
tic
%%%%%%%%%%%
%--------------
%figure(30);%%%%%%%%%%%%%%%%
% [X,Y]=meshgrid(1:1024,1:1024);
%mesh(X,Y,ZCHARGE); %
%view(90,90);
%axis square;
%title('CHARGE=zsat-zburns');
%---------------------
%%%++++++++++++++++++++++
%the stuff from MAD
%filenum=[133 145];%%====
%%filenum=[117 122];%%%============
%filenum=[110 111 112 113 114 115 116 117 118 119 120 ...
% 121 122 123 124 125 126 127 128 129 130 131 132 ...
% 133 134 135 136 137 138 139 140 141 142 143 144 ...
%% % all 145 146 147 148 149 150 151 157 ];
filenum=[110 111 112 113 114 115 116 117 118 119 120 ...
121 122 123 124 125 126 127 128 129 131 132 ...
133 134 135 136 137 138 139 140 143 144 ...
145 146 147 148 149 150 151 157 ];
%filenum=[110 117 122 126 128 129 133 140 145 151 157 ];
%117,122,133,145 halfway up, max, min, next max
%filenum=[ 117 122 128 140 ];
numfiles=length(filenum);
V1max=zeros(numfiles,1);
V2max=zeros(numfiles,1);
HITE=zeros(numfiles,1);
FW=zeros(numfiles,1);
CENTER=zeros(numfiles,1);
for inSPE=1:numfiles
BURNS='726a166.spe';%burns only
fid=fopen(BURNS,'r');
header=fread(fid,2050,'uint16'); %4100bytes/2
ZBURNS=fread(fid,1024*1024,'uint16');
ZBURNS=reshape(ZBURNS,1024,1024);
fclose(fid);
ZBURNS=double(ZBURNS);
%figure(10);%%%%%%%%%%%%%%%%%%
%[X,Y]=meshgrid(1:1024,1:1024);
%mesh(X,Y,ZBURNS); %
%view(90,90);
%axis square;
%title(' BURNS ');
%----------
SAT='726a163.spe';%saturated has burns and anomalous charge scat.
fid=fopen(SAT,'r');
header=fread(fid,2050,'uint16'); %4100bytes/2
ZSAT=fread(fid,1024*1024,'uint16');
ZSAT=reshape(ZSAT,1024,1024);
fclose(fid);
ZSAT=double(ZSAT);
%figure(20);%%%%%%%%%%%%%
% [X,Y]=meshgrid(1:1024,1:1024);
%%%figure(20 +inSPE);
%mesh(X,Y,ZSAT); %
%view(90,90);
%axis square;
%title('Saturated and burns');
%------------------
ZCHARGE=ZSAT-ZBURNS;
clear ZSAT;
clear ZBURNS;
numfid=num2str(filenum(inSPE));
file=strcat('726a',numfid,'.spe');
%file='726a163.spe'
fid=fopen(file,'r');
header=fread(fid,2050,'uint16'); %4100bytes/2
Z=fread(fid,1024*1024,'uint16');
Z=reshape(Z,1024,1024);
fclose(fid);
Z=double(Z);
minZ=min(min(Z));
Z=Z-ZCHARGE;
%%
%%%threshold image so that anything less than minimum
%%%of the original image is reset to that original
%%%% minimum value
for x=1:1024
for y=1:1024
if (Z(x,y) < minZ) % set minimum to min of
% original Z
Z(x,y)=minZ;
end% if
end%y
end %x
clear ZCHARGE ;
%%==figure(1);
%Zav=Zav + Z;
%[X,Y]=meshgrid(1:1024,1:1024);
%%%figure(20 +inSPE);
%%%mesh(X,Y,Z); %
%view(90,90);
%axis square;
%title(file);
%%%end% inSPE
%%%
ImageMatrix = Z;
clear Z;
%%%
RadiusBlocker=125;%%specific for our blocker size
xtry=512;
ytry=512;
%%%%%%%%%%%%%%%%%%%%%%%%%%%%%%%
%%%%%%%%%%%%%%%%%%%%%%%%%%%%%%%%%%%%%%%%%%%%%
%%%specific for the ccd burns on our camera
%%%% at a given time
%%% It is possible to write a program to find the burns
%%%% automatically but I didn't do it in this program
%%%%%%%%%%%%%%%%%%%%
%%%%%%%%%%%%%%%%%%%%%
MaskMatrix = ones(1024);
%%%need to get more of it
%for x=495:545 % the big burn on the bottom center
% for y=940:990
for x=485:555%%the big burn
for y=930:1000
MaskMatrix(x,y)=0;
end
end
%%add another
for x=400:430
for y=880:920
MaskMatrix(x,y)=0;
end%y
end%x
% TryMask generated
%phi=angle to rotate MaskMatrix about (xtry,ytry)
phi=-pi/2;
%phi = pi/2;%%%original direction from main
cosphi = cos(phi);
sinphi = sin(phi);
%TryMask will be zeros everywhere and ones where the hotspots are
TryMask = ones(1024) - MaskMatrix;
% need to adjust for xtry,ytry
for x=1:1024
for y=1:1024
if(TryMask(x,y) == 1)
xback = ceil(x*cosphi + y*sinphi + xtry*(1-cosphi)-ytry*sinphi);
yback = ceil(-x*sinphi +y*cosphi +xtry*sinphi +ytry*(1-cosphi));
%check that xback and yback are within limits
if xback >0 & xback <1025
if yback >0 & yback <1025
TryMask(x,y) = ImageMatrix(xback,yback);
end%if yback
end% if xback
end%if TryMask
end%y
end%x
%spy(TryMask);
%view(90,90);
TryMatrix = ImageMatrix .* MaskMatrix + TryMask;
%%%%%%%%%%%%%%%%%%%%%%%%%%%%%%%%%%%%%%%%%%%%%%%%%%%%
%%%%%%%%%%%plot of spots corrected on ccd%%%%%%%%%
%%%%%%%%%%%%
clear ImageMatrix;
%%%%%%%%%%%%%%%%%%%%%%%%%%%%%%%%%%%%%%%%%%%%%%%%%%
%%
%%
%%%%%%%%%%%
%%%%%%%%%%%%%%%%%%%%%%%%%%%%%%%
%%%%%%%%%%%%%%%%%%%%%%%%%%%%%%%%%%%%%%%%%%%%%%%%%%%%%%%%%%%%%%%%
RadiusBlocker=125;%assumed radius of blocker relative to xtry,ytry
xtry=512;%assumed center
ytry=512;
%%%%%%%%%%%%%%%%%%%
%%%%%%%%
%%%%%%%%%%%%%%%%%location of hotspots%%%%%%%%%%%%%%%%
%%%% ImageMatrix=TryMatrix
ImageMatrix=TryMatrix;
%%%%%%%%%%%%%%%%%%%%subject to almost certain change
%%%%%%%%%%%%
%nine hot spots (x,y,z) of [lower left,upper right]
%[(468,43,942),(514,6,984)] bright
%[(427,296,1416),(437,291,1128)] bright
% [(420,200,968),(438,196,524)] faint
% [(523,236,1672),(531,226,1562)] bright
% [(523,226, faint),(531,209,626)] faint combine with previous
% [(475,654,959),(495,621,520)] bright
%[(461,716,1000),(465,712,1000)] faint guessing numbers
%[(397,898,1420),(427,878,1270)] bright
% [(574,907,785),(580,902,1015)] faint
MaskMatrix = ones(1024);
for x=468:514
for y=6:43
MaskMatrix(x,y)=0;
end
end
for x=427:437
for y=291:296
MaskMatrix(x,y)=0;
end
end
for x=420:438
for y=196:200
MaskMatrix(x,y)=0;
end
end
for x=523:531
for y=226:236
MaskMatrix(x,y)=0;
end
end
for x=523:531
for y=209:226
MaskMatrix(x,y)=0;
end
end
for x=475:495
for y=621:654
MaskMatrix(x,y)=0;
end
end
for x=461:465
for y=712:716
MaskMatrix(x,y)=0;
end
end
for x=397:427
for y=878:898
MaskMatrix(x,y)=0;
end
end
for x=574:580
for y=902:907
MaskMatrix(x,y)=0;
end
end
%spy(MaskMatrix);
%view(90,90);
% TryMask generated
%phi=angle to rotate MaskMatrix about (xtry,ytry)
phi = pi/2;
cosphi = cos(phi);
sinphi = sin(phi);
%TryMask will be zeros everywhere and ones where the hotspots are
TryMask = ones(1024) - MaskMatrix;
% need to adjust for xtry,ytry
for x=1:1024
for y=1:1024
if(TryMask(x,y) == 1)
xback = ceil(x*cosphi + y*sinphi + xtry*(1-cosphi)-ytry*sinphi);
yback = ceil(-x*sinphi +y*cosphi +xtry*sinphi +ytry*(1-cosphi));
%check that xback and yback are within limits
if xback >0 & xback <1025
if yback >0 & yback <1025
TryMask(x,y) = ImageMatrix(xback,yback);
end%if yback
end% if xback
end%if TryMask
end%y
end%x
for x=2:1023
for y=2:1023
if(TryMask(x,y)==1) %%%FIXed
TryMask(x,y)=ImageMatrix(2*xtry-x,2*ytry-y);
%TryMask(x,y)=(TryMask(x+1,y)+TryMask(x-1,y)...
% +TryMask(x,y+1)+TryMask(x,y-1))/4;
end%if
end%y
end%x
%spy(TryMask);
%view(90,90);
TryMatrix = ImageMatrix .* MaskMatrix + TryMask;
%%%%%%%%%%%%%%%%%%%%%%%%%%%%%%%%%%%%%%%%%%%%%%%%%%%%
%%%%%%%%%%%plot of 8 spots corrected on ccd%%%%%%%%%
%%%%%%%%%%%%
%%%figure(4);
%[X,Y]=meshgrid(1:1024,1:1024);
%%%mesh(X,Y,TryMatrix);
%axis square;
%%%title('automated correction of 8 hotspots on ccd');
%view(90,90);% looks like Winview
%%%%%%%%%%%%%%%%%%%%%%%%%%%%%%%%%%%%%%%%%%%%%%%%%%
%
%The blocker is off center so by useing a
%larger blocker radius we may help
%RadiusBlocker may not be too critical because
% blocker very faint except at a few spots
%we find the max intensity and go outwards
%from that --avoiding the blocker
%%%%%%%===%%%%%%%%%%%%%%%%===%%%%%%%%===%%%%%%%%%%%
%%%++++++%%%%+++++++++++%%%%%%%%%%%%%%%%+++%%%%%%%%
%360 x,y,z points store in xi,yi,zi
xi=zeros(1,360);
yi=zeros(1,360);
zi=zeros(1,360);
nrmax1 = min(xtry,1024-xtry) -7;%% could change 7 to something
nrmax2 = min(ytry,1024-ytry) -7;% to avoid edge of ccd
nrmax=min(nrmax1,nrmax2);%nrmax should not run off ccd
nr=nrmax-RadiusBlocker;%number of radial points per angle
zith=zeros(1,nr);xith=zeros(1,nr);yith=zeros(1,nr);
%points of radius < RadiusBlocker and > nrmax are avoided
for ith=1:360
for rth=nrmax:-1:RadiusBlocker % in toward center on a ray
xith(rth)=ceil(xtry +rth*sin(ith*2*pi/360));
%round up to nearest integer
yith(rth)=ceil(ytry -rth*cos(ith*2*pi/360));
zith(rth)=TryMatrix(xith(rth),yith(rth));
end%rth
%find max zith and corresponding xith and yith and store
%%%%10/15/03 uncomment 231-234 (10/28 commented231-7 again)
% if ( ith> 74 & ith< 89)% %%FOUND THE BLOCKER
% figure(ith)
% plot(zith,'*');
%concatT=strcat(int2str(ith),' degrees');
%title(concatT)
% title([int2str(ith) ,' degrees'])
%end
[rv,mth]=sort(zith);%rv(nr)=maximum
xi(ith)=xith(mth(nr));
yi(ith)=yith(mth(nr));
% xi(ith)=ceil(xtry +mth(nr)*sin(ith*2*pi/360));
%yi(ith)=ceil(ytry -mth(nr)*cos(ith*2*pi/360));
zi(ith)=rv(nr);
end% ith
%%%%% sort and drop lowest intensity
[zs,is]=sort(zi); %sorts intensities in ascending order
%zs=zi(is)
%assuming one maximum; sometime should fix it so
% the outermost maximum is used 10/18/03 Ndrop 160-->20
Ndrop=20;%%number of points out of 360 to drop
%drop lowest Ndrop intensities
%(this gets rid of straight part blocker)
%and store Ncircle points 360-Ndrop
% xp,yp are Ncircle points on the
%%circumference of max. intenity
%as viewed from approaching corners to center of ccd
Ncircle=360-Ndrop;
zp=zeros(1,Ncircle);
xp=zeros(1,Ncircle);
yp=zeros(1,Ncircle);
for ip=1:Ncircle % Ncircle maximums
zp(ip)=zs(is(ip+Ndrop));
xp(ip)=xi(is(ip+Ndrop));
yp(ip)=yi(is(ip+Ndrop));
end % ip
%figure(400);
%plot(xp,yp,'ko') % plot the Ncircle points on the circumference
%%axis square;
%%hold on;
%%%%%%%%%%%%%=======%%%%%%%%%%%%%%%%%%%%%%%%======%%%%%%%%%%%%%%%
%%%%%%%%%%%%%+++++++++++++%%%%%%%%%%%%%%%%%%+++%%%%%%%%%%%++%%%
%
%
%%%%%%%%%%%%%%%%%%%%%%%%%%%%%%%%%%%%%%%%%%%%%%%%%%%
%%%%%%%%%%%%%%%%%%%%%least squares%%%%%%%%%%%%%%%%%%%%%
%%%%%%%%%%%%%%%%%%%%%%%%%%%%%%%%%%%%%%%%%%%%%%%%%%%%%%%
% find tentative center of these points using least squares
%and radius R
% xp^2+yp^2 + a(1)*xp + a(2)*yp + a(3) = 0
nN=length(xp); xx=xp.*xp; yy=yp.*yp; xy=xp .* yp;
Als=[sum(xp) sum(yp) nN;sum(xy) sum(yy) sum(yp);sum(xx) sum(xy) sum(xp)];
Bls=[-sum(xx+yy); -sum(xx.*yp + yy .*yp);-sum(xx.*xp+xy.*yp)];
als=Als\Bls;
xc= -als(1)/2 ; %center of circle
yc= -als(2)/2 ;
R=sqrt((als(1)^2 + als(2)^2)/4 -als(3)) ; %radius of circle
%%%%%%%%%%%%%%%%%%%%%%%%%%%%%%%%%%%%%%%%%%%%%%%%%%%%%%%%%%%%%%%%
% at this point we have rotated around the assumed center
%to get 8 hotspots on ccd "smoothed"
%dropping the blocker stick from the circle of max. intensity
%using least squares on the Ncircle points that were not
%dropped finding (xc,yc) as center of radius R
% we will now extrapolate across the blocker
% arm . Plot the intensities around the circle.
% plot circle of radius R onto circle of max intensity
x7=zeros(1,360);
y7=zeros(1,360);
for nth=1:360
x7(nth)=round(xc + R*sin(nth*2*pi/360));
y7(nth)=round(yc + R*cos(nth*2*pi/360)); %corrected 11/09/03
end
%%plot(x7,y7,'r','LineWidth',2)
%%axis square;
%%concatT=strcat('circle of max.int. LSfit radius= ',num2str(R),'center= ',num2str(round(xc)),',',num2str(round(yc)));
%%%title(concatT);
%%gtext('starting with xtry=512, ytry=512')
%%%hold off;
%%%print -djpeg40 CMI512512.jpg
%%%%%%%===%%%%%%%%%%%%%%%%===%%%%%%%%===%%%%%%%%%%%
%points of radius < RadiusBlocker and > nrmax are avoided
%nrmax=round(min(xc,yc));
djpeg20=['djpeg',int2str(20)]; %around 40k
nrmax=490;% changed 12/14/03
%nrmax=500;
for ith=1:360
for rth=nrmax:-1:RadiusBlocker % in toward center on a ray
xith(rth)=ceil(xc +rth*sin(ith*2*pi/360));
%round up to nearest integer
yith(rth)=ceil(yc -rth*cos(ith*2*pi/360));
zith(rth)=TryMatrix(xith(rth),yith(rth));
end%rth
%find max zith and corresponding xith and yith and store
%if ( ith> 74 & ith< 89)% %%FOUND THE BLOCKER
% figure(ith)
% plot(zith,'*');
% axis([150 500 0 3*10^4]);
%concatT=strcat(int2str(ith),' degrees');
%title(concatT)
%title([int2str(ith) ,' degrees']);
%outputfile=['AngSpeckle630D13-',int2str(ith)];
% eval(['print -',djpeg20 ' C:\matlab_sv13\work\',outputfile]);
% end
% [rv,mth]=sort(zith);%rv(nr)=maximum
%xi(ith)=xith(mth(nr));
%yi(ith)=yith(mth(nr));
% xi(ith)=ceil(xtry +mth(nr)*sin(ith*2*pi/360));
%yi(ith)=ceil(ytry -mth(nr)*cos(ith*2*pi/360));
%zi(ith)=rv(nr);
end% ith
%%%++++++%%%%+++++++++++%%%%%%%%%%%%%%%%+++%%%%%%%%
%360 x,y,z points store in xi,yi,zi
xi=zeros(1,360);
yi=zeros(1,360);
zi=zeros(1,360);
for ith=1:360
rth=ceil(R) ;% around circle of radius R
xi(ith)=ceil(xc +rth*sin(ith*2*pi/360));
%round up to nearest integer
yi(ith)=ceil(yc -rth*cos(ith*2*pi/360));
zi(ith)=TryMatrix(xi(ith),yi(ith));
%[rv,mth]=sort(zi);%rv(360)=maximum
% xi(ith)=xith(mth(nr));
% yi(ith)=yith(mth(nr));
% xi(ith)=ceil(xtry +mth(nr)*sin(ith*2*pi/360));
%yi(ith)=ceil(ytry -mth(nr)*cos(ith*2*pi/360));
%zi(ith)=rv(nr);
end% ith
%%%%% sort and drop lowest intensity
[zs,is]=sort(zi); %sorts intensities in ascending order
%zs=zi(is)
dy=diff(zs)./diff(is);
dx=[1:20];
dz=dy(1:20);ddz=diff(dy);
d2z=ddz(1:20);
%dy=[dy dy(359)];
%plot(dx,dz,dx,d2z)
[maxd2z,maxnum]=max(d2z);
[mind2z,minnum]=min(d2z);
%finding where second derivative changes sign
%%%%%%%%%%%%%%%%%%% zero crossing
angularWidth=ceil(max(maxnum,minnum));
ais=is(1:angularWidth);
beginAngle=floor(min(ais)); % beginning angle of BLockerArm
% on the circle of max. intensity
%endAngle =ceil(beginAngle + angularWidth -1 );%chenged this ***
if(angularWidth-floor((angularWidth/2))*2 )==1 %%angW is ODD
endAngle= beginAngle + angularWidth -1;
midAngle= (beginAngle + endAngle)/2;
end% if odd angularWidth
if(angularWidth-floor((angularWidth/2))*2 )==0 %%angW is even
endAngle=beginAngle + angularWidth;
midAngle=(beginAngle+endAngle)/2;
end% if even
%
%a point (x,y) relative to (xc,yc) on the circumference
% of the circle of radius R is
%xR= xc +R*sin(theta*2*pi/360);
% y = yc -R*cos(theta*2*pi/360)
%%%%%%%%%%%%%%%%%%%%%%%%%%%%%%
%%%%%%% made changes ****
%%%%%%%%%%%%%%%%%%%%%%%%%%%%%
%do it wider %%%%%
%endAngle=2*endAngle -beginAngle +2;%double width +2 degrees
%beginAngle=beginAngle -2;% two degrees wider on top
RB=RadiusBlocker ; %%%%%%%%%%%%
%RB = RadiusBlocker;
MaskMatrix=ones(1024);
%MaskBlockArm=ones(1024);
%for theta=beginAngle:endAngle
%%%%%%%%%%%%%%%%%%%%%%%%
%%%%%%%%start at blocker****************
%%%%%%%%%%%%%%%%%%%%%%
xB=ceil(xc +RB*sin((beginAngle)*2*pi/360));
%xR=ceil(xc +R*sin((beginAngle)*2*pi/360));
%xR coord.on circle radius R
midAngle=ceil((beginAngle + endAngle) /2);
for x=xB:1024
%for x=round(xc):1024 %%%no effect%%
for y=1:1024
% two lines parallel to line of midAngle
%if y1 <=y <=y2 mark it
y1=(-x+xc+R*sin(beginAngle*2*pi/360))*cot(midAngle*2*pi/360);
y1=ceil(y1+yc-R*cos(beginAngle*2*pi/360));% y coord. lies between
y2=(-x+xc+R*sin(endAngle*2*pi/360))*cot(midAngle*2*pi/360);
y2=ceil(y2+yc-R*cos(endAngle*2*pi/360));% y coord. lies between
if (y1-40 <=y) & (y <= y2 + 40) % make wider %%%this WORKED!!!!!
%if y1 <=y & y <= y2 %
%MaskBlockArm(x,y)=0;
MaskMatrix(x,y)=0;
end % if
end %y
end %x
%spy(MaskMatrix);
%view(90,90);
%axis square;
%%%%%%%blocker%%%%%%%%%%%%%%%%%%%%%%%%%%%%%%%%%%%%%%block%%%%%%%%
%%%%%%%blocker%%%%%%%%%%%%%%%%%%%%%%%%%%%%%%%%%%%%%%block%%%%%%%%
%%%%%%%blocker%%%%%%%%%%%%%%%%%%%%%%%%%%%%%%%%%%%%%%block%%%%%%%%
%TryMatrixB=TryMatrix;
%phiB=angle to rotate MaskBlockArm about (xc,yc)
phiB = - pi/4 ;
cosphi = cos(phiB);
sinphi = sin(phiB);
%TryMaskB will be zeros everywhere and ones where the hotspots are
TryMask=ones(1024) - MaskMatrix;
%TryMaskB = ones(1024) - MaskBlockArm;
% need to adjust for xc,yc
for x=1:1024
for y=1:1024
if (TryMask(x,y) == 1)
%if(TryMaskB(x,y) == 1)
xback = ceil(x*cosphi + y*sinphi + xc*(1-cosphi)-yc*sinphi);
yback = ceil(-x*sinphi +y*cosphi +xc*sinphi +yc*(1-cosphi));
%check that xback and yback are within limits
if xback >0 & xback <1025
if yback >0 & yback <1025
TryMask(x,y) = TryMatrix(xback,yback);
% TryMaskB(x,y) = TryMatrix(xback,yback);
end%if yback
end% if xback
end%if TryMask
end%y
end%x
for x=2:1023
for y=2:1023
% if(TryMaskB(x,y)==1)
%TryMaskB(x,y)=(TryMaskB(x+1,y)+TryMaskB(x-1,y)+TryMaskB(x,y+1)
%%%% +TryMaskB(x,y-1))/4;
if(TryMask(x,y)==1) %%%FIXed
TryMask(x,y)=TryMatrix(2*xtry-x,2*ytry-y);
%TryMask(x,y)=(TryMask(x+1,y)+TryMask(x-1,y)+...
%TryMask(x,y+1)+TryMask(x,y-1))/4;
end%if
%end%if
end%y
end%x
%spy(TryMask);
%view(90,90);
TryMatrix= TryMatrix .* MaskMatrix + TryMask;
%TryMatrixB = TryMatrix .* MaskBlockArm + TryMaskB;
%%%%%%%%%%%%%%%%%%%%%%%%%%%%%%%%%%%%%%%%%%%%%%%%%%%%
%now blocker arm outside of circle of maximum
%intensity should be smoothed. Let's see
%figure(16);
%[X,Y]=meshgrid(1:1024,1:1024);
%mesh(X,Y,TryMatrixB);
%axis square;
%view(90,90);% looks like Winview
%title('corrected hotspots and part of blocker arm');
%%%%%%%blocker%%%%%%%%%%%%%%%%%%%%%%%%%%%%%%%%%%%%%%block%%%%%%%%
%%%%%%%blocker%%%%%%%%%%%%%%%%%%%%%%%%%%%%%%%%%%%%%%block%%%%%%%%
%%%%%%%blocker%%%%%%%%%%%%%%%%%%%%%%%%%%%%%%%%%%%%%%block%%%%%%%%
%%%%%%%%%%%%%%%%%Far Right%%%%%%%%%%%%%%%%
%%%%%%
%%%%%%%%%%%%%%%%%%%%%%%%%%%%%%%%%%%%%%%%%%FR%%%%%%%%%
MaskMatrix=ones(1024);
FR=985;
for y=1:1024
for x=FR:1024
MaskMatrix(x,y)=0;
end%x
end%y
TryMask=ones(1024) - MaskMatrix;
%TryMaskB=ones(1024)-MaskMatrix;
phi=pi;% angle to rotate tryMaskB
cosphi = cos(phi);
sinphi = sin(phi);
%TryMaskB will be zeros everywhere and ones where the area of interest is
% need to adjust for xc,yc
for x=1:1024
for y=1:1024
if(TryMask(x,y) == 1)
%if(TryMaskB(x,y) == 1)
xback = ceil(x*cosphi + y*sinphi + xc*(1-cosphi)-yc*sinphi);
yback = ceil(-x*sinphi +y*cosphi +xc*sinphi +yc*(1-cosphi));
%check that xback and yback are within limits
if xback >0 & xback <1025
if yback >0 & yback <1025
TryMask(x,y) = TryMatrix(xback,yback);
%TryMaskB(x,y) = TryMatrix(xback,yback);
end%if yback
end% if xback
end%if TryMask
end%y
end%x
for x=2:1023
for y=2:1023
if(TryMask(x,y)==1)
% if(TryMaskB(x,y)==1)
%TryMaskB(x,y)=(TryMaskB(x+1,y)+TryMaskB(x-1,y)+
%% TryMaskB(x,y+1)+TryMaskB(x,y-1))/4;
TryMask(x,y)=TryMatrix(2*xtry-x,y); %FIXed
%TryMask(x,y)=(TryMask(x+1,y)+TryMask(x-1,y)+TryMask(x,y+1)+TryMask(x,y-1))/4;
end%if
end%y
end%x
%spy(TryMask);
%view(90,90);
TryMatrix=TryMatrix .* MaskMatrix + TryMask;
%TryMatrix = TryMatrixB .* MaskMatrix + TryMaskB;
%%%%%%%%%%%%%%%%%%%%%%%%%%%%%%%%%%%%%%%%%%%%%%%%%%%%
%now far right
%intensity should be smoothed. Let's see
%figure(17);
%[X,Y]=meshgrid(1:1024,1:1024);
%mesh(X,Y,TryMatrix);
%axis square;
%view(90,90);% looks like Winview
%title('630D13.spe corrected hotspots,part of blocker & far right');
%%%%%%%%%%%%%%%%%%%%%%%%%%%
% smootoh area inside blocker
%%
%%%%%%%%%%%%%%%%%Far Right%%%%%%%%%%%%%%%%
%%%%%%
%%%%%%%%%%%%%%%%%%%%%%%%%%%%%%%%%%%%%%%%%%FR%%%%%%%%%
%%%%%%%%%%%%%%%%%upper and lower edge%%%%%%%%%%%%%%%%
%%%%%%
%%%%%%%%%%%%%%%%%%%%%%%%%%%%%%%%%%%%%%upper and lower%%%%%%%%%
MaskMatrix=ones(1024);
%FR=985;
for x=1:1024
for y=1:12
MaskMatrix(x,y)=0;
end%x
end%y
for x=1:1024
for y=1020:1024
MaskMatrix(x,y)=0;
end
end
TryMask=ones(1024) - MaskMatrix;
phi=pi/2;% angle to rotate tryMask
cosphi = cos(phi);
sinphi = sin(phi);
%TryMaskB will be zeros everywhere and ones where the hotspots are
% need to adjust for xc,yc
for x=1:1024
for y=1:1024
if(TryMask(x,y) == 1)
xback = ceil(x*cosphi + y*sinphi + xc*(1-cosphi)-yc*sinphi);
yback = ceil(-x*sinphi +y*cosphi +xc*sinphi +yc*(1-cosphi));
%check that xback and yback are within limits
if xback >0 & xback <1025
if yback >0 & yback <1025
TryMask(x,y) = TryMatrix(xback,yback);
end%if yback
end% if xback
end%if TryMask
end%y
end%x
for x=2:1023
for y=2:1023
if(TryMask(x,y)==1) %%%%FIXed
%if TryMask failed to grab the value what to use?
% use a TryMask(x,y) with same radius
TryMask(x,y)=TryMatrix(2*xtry-x,2*ytry-y);
%TryMask(x,y)=(TryMask(x+1,y)+TryMask(x-1,y)+TryMask(x,y+1)+TryMask(x,y-1))/4;
end%if
end%y
end%x
%spy(TryMask);
%view(90,90);
TryMatrix=TryMatrix .* MaskMatrix + TryMask;
%%%%%%%%%%%%%%%%%%%%%%%%%
%%%begin centroid
%%%%%%%%%%%%%%
%%%%%
xcen=0;
ycen=0;
sumint=0;
for x=1:1024
for y=1:1024
%outside circle of maximum intensity
if ((x-xc)*(x-xc) + (y-yc)*(y-yc)) >= R
intensity= TryMatrix(x,y);
xcen = xcen + intensity * x;
ycen = ycen + intensity * y;
sumint=sumint + intensity;
end% if >=R
end %y
end%x
xcen=xcen/sumint;
ycen=ycen/sumint;
%center of the pattern%%%%%%%%%%%%%%%%%%%%%%center%%%%%%%%%%%%
%%xcen=xcen %%don't print(run faster?)
%%%ycen=ycen
%%%%%%%%%%%%%%%%%centroid found%%%%%%%%%%%%%%%%
%%%%%%
%%%%%%%%%%%%%%%%%%%%%%%%%%%%%%%%%%%%%%%%%%%%%%%%%%%
%%%%%%%%begin%%%%%%%%%%%%smooth center of blocker************
%%%%%%%%%%%%%%%%%%
%%
%%%
%%%%%%%%%%%%%%%%%%%%%%%%%%
MaskMatrix=ones(1024);%%al ones
TryMask=ones(1024)-MaskMatrix;%all zeros
minBlocker =100000000000;
%%%%%%%==================
%%%==set value of minBlocker to value of
%%% min of far right background
%********************
for y=1:1024
for x=985:1024
%% if (x-xcen)*(x-xcen) + (y-ycen)*(y-ycen) <= RB*RB
%find minimum value
if TryMatrix(x,y) < minBlocker
minBlocker=TryMatrix(x,y);
end % if
% TryMask(x,y)=(TryMask(x+1,y)+TryMask(x-1,y)+
%%%% TryMask(x,y-1)+TryMask(x,y+1))/4;
%%end % if
end % x
end % y
RBB=RB + 30;% increase to 125 + 30
%%%%found minBlocker=min value of TryMatrix within the blocker
for x=1:1024 %make smaller********************
for y=1:1024
if (x-xcen)*(x-xcen) + (y-ycen)*(y-ycen) <= RBB*RBB
MaskMatrix(x,y)=0;
TryMask(x,y)=minBlocker;
% TryMask(x,y)=(TryMask(x+1,y)+TryMask(x-1,y)+TryMask(x,y-1)+TryMask(x,y+1))/4;
end % if
end % y
end % x
TryMatrix=TryMatrix .* MaskMatrix + TryMask;
%%%%%%end%%%%%%smooth center of blocker %%%%%%%%%%%
%%%%%%%%%%%%%%%%%%%%%%%%%%%%%%%%%%%%%%%%%%%%%%
%%%%%%%%%%%%%%%%%%%%%%%%%%%%%%%%%%%%%%%%%%%%%%%%%%%%
%autoconvolution %%%%%%%%%%%%%%%%%%%%%%%%
%%%%%%%%%%%%%%%%%%%%%%%
%%%%%%%%%%%%%%%%%%%%%%%%
%nb=1024;
%B=TryMatrix;% TryMatrix
%reverse conjugate
%B=conj(B(nb:-1:1,nb:-1:1));
%use power of 2 transform lengths
%nf=2^nextpow2(2*nb);
%at=fft2(B,nf,nf);
%bt=fft2(TryMatrix,nf,nf);
%multiply transform then inverse
%ZZ=ifft2(at.*bt);
%make real ouput for real input
%if ~any(any(imag(TryMatrix))) & ~any(any(imag(B)))
% ZZ = real(ZZ);
%end
%trim
%ZZ(2*nb:nf,:)=[];
%ZZ(:,2*nb:nf)=[];
%[X,Y]=meshgrid(1:2047,1:2047);
%[X,Y]=meshgrid(1:1024,1:1024);
%figure(3);
%ZZ=conv2(Z,Z); this ran more than half hour & had to be killed
%mesh(X,Y,ZZ);
%view(90,90);
%axis square;
%figure(5);
%axis square;
%contourf(X,Y,ZZ);
%view(90,90);
%hold on;
%shading flat;
%vf=(10^13)*linspace(1,3,50);
%[cf,hf]=contour(X,Y,ZZ,vf);
%clabel(cf,hf);
%colorbar;
%view(90,90);
%title('autoconvolution 630D13.SPE adjusted');
%print -djpeg99 Aout1.jpg
%%%%%%%%%%%%%%%%%%%%%%%%%%%%%%%%
%%%% auto-correlation
%%now shift center of pattern to center of TryMatrix
%and do autocorrelation using fourier transforms
cenMatrix=zeros(1024);
xcc=round(xcen-xtry);
ycc=round(ycen-ytry);
minOfTryMatrix=min(min(TryMatrix));
for x=1:1024
for y=1:1024
if (x-xcc)>0 & (x-xcc) < 1025 & (y-ycc) > 0 & (y-ycc) < 1025
cenMatrix(x,y)=TryMatrix(x-xcc,y-ycc);
else cenMatrix(x,y)=minOfTryMatrix;
end% if
end%for y
end % for x
for x=2:1023
for y=2:1023
if cenMatrix(x,y) == 0
cenMatrix(x,y)=(cenMatrix(x+1,y)+cenMatrix(x-1,y)+cenMatrix(x,y+1));
cenMatrix(x,y)=(cenMatrix(x,y)+cenMatrix(x,y-1))/4 + minOfTryMatrix;
%%%%added minOfTryMatrix was zero before
end%if
end%y
end%x
%%%%%%%%%%%%%%%%%%%%%%%%finished centering
%%%%%
%%
%%%----turn off donut
%%%
if inSPE == 350 %%==was if inSPE == 3
figure(2);
% figure(100 + inSPE);
[X,Y]=meshgrid(1:1024,1:1024);
mesh(X,Y,cenMatrix);
axis square;
%title(file);%%%===========
view(90,90);% looks like Winview
%print -djpeg99 Fig2.jpg
print -deps phig2.eps%%%======
figure(3);
% figure(100 + inSPE);
[X,Y]=meshgrid(1:1024,1:1024);
mesh(X,Y,cenMatrix);
axis square;
%%title(file);%%%==========
% looks like Winview
axis tight;
print -deps phig3.eps%%%=======
end %% inSPE is 3
%%%~~~~~~~~~~~~~~~~~~~~~~~~~~~~~~~~~~~~~~~~~~~~~~~~~~~~~~~~~~~~~~~~~~~~~~
%%%%%%%%%%% angular intensity
%%%added 11/9/03%%%%%
%%
%Look at angle of each pixel and place it in bins(1 to 360)
%Calculate average intensity of angular bin
%each bin is one degree wide number of bins=360
Xcenter=512;Ycenter=512;%since we've already done everything & moved it
BinAngIntensityVec=zeros(1,360);
PixelsinAngBinVec=ones(1,360);%always has one
AvgBinAngIntensityVec=zeros(1,360);
%for m=1:1024
% for n=1:1024
% if ((m==Xcenter) & (n==Ycenter))
for xang=1:1024
for yang=1:1024
%if((xang==Xcenter) & (yang==Ycenter))
%continue
%end
%Angr= atan2(n,m);%atan2 goes from -pi to +pi
% atan2(y,x)
% Angr= atan2(n-Ycenter,m-Xcenter);%atan2 goes from -pi to +pi
Angr= atan2(yang - Ycenter,xang - Xcenter);%atan2 goes from -pi to +pi
%Bin is an index and must be greater than 1
% if(Angr <= 0)
% Angr =Angr + 2*pi;
%end % Angr now runs from 0 to 2*pi
Angr=Angr + pi;% now runs 0 -> 2*pi
Bin=fix((180/pi)*Angr);%number from 0 to 360
if (Bin == 0 ) | (Bin > 360)
continue
end
%if Bin < 0
% Bin=Bin +180 ;
%end
%Bin goes from 1 to 360 hopefully
% BinAngIntensityVec(Bin)=BinAngIntensityVec(Bin) + cenMatrix(m,n);
BinAngIntensityVec(Bin)=BinAngIntensityVec(Bin) + cenMatrix(xang,yang);
PixelsinAngBinVec(Bin)=PixelsinAngBinVec(Bin) + 1;
end %end yang
end %end xang
% average intenstiy in each Bin
%thetaBin=zeros(1,360);
%rosedata=zeros(1,360);
%AngFileArray=zeros(2,360);
for j=1:360
AvgBinAngIntensityVec(j)=BinAngIntensityVec(j)./PixelsinAngBinVec(j) ;
% thetaBin(j)=j;
% rosedata(j)=AvgBinAngIntensityVec(j);
%AngFileArray(1,j)=j;
%AngFileArray(2,j)=AvgBinAngIntensityVec(j);
end % end j
%theta=AngFileArray(1,:); %%angular bin
%rosedata=AngFileArray(2,:); %%call rose(rosedata,360);
%%%---turn off polar
%figure(300 + inSPE);
%rose(BinAngIntensityVec./PixelsinAngBinVec,360)
%%if inSPE == 350
if inSPE == 13
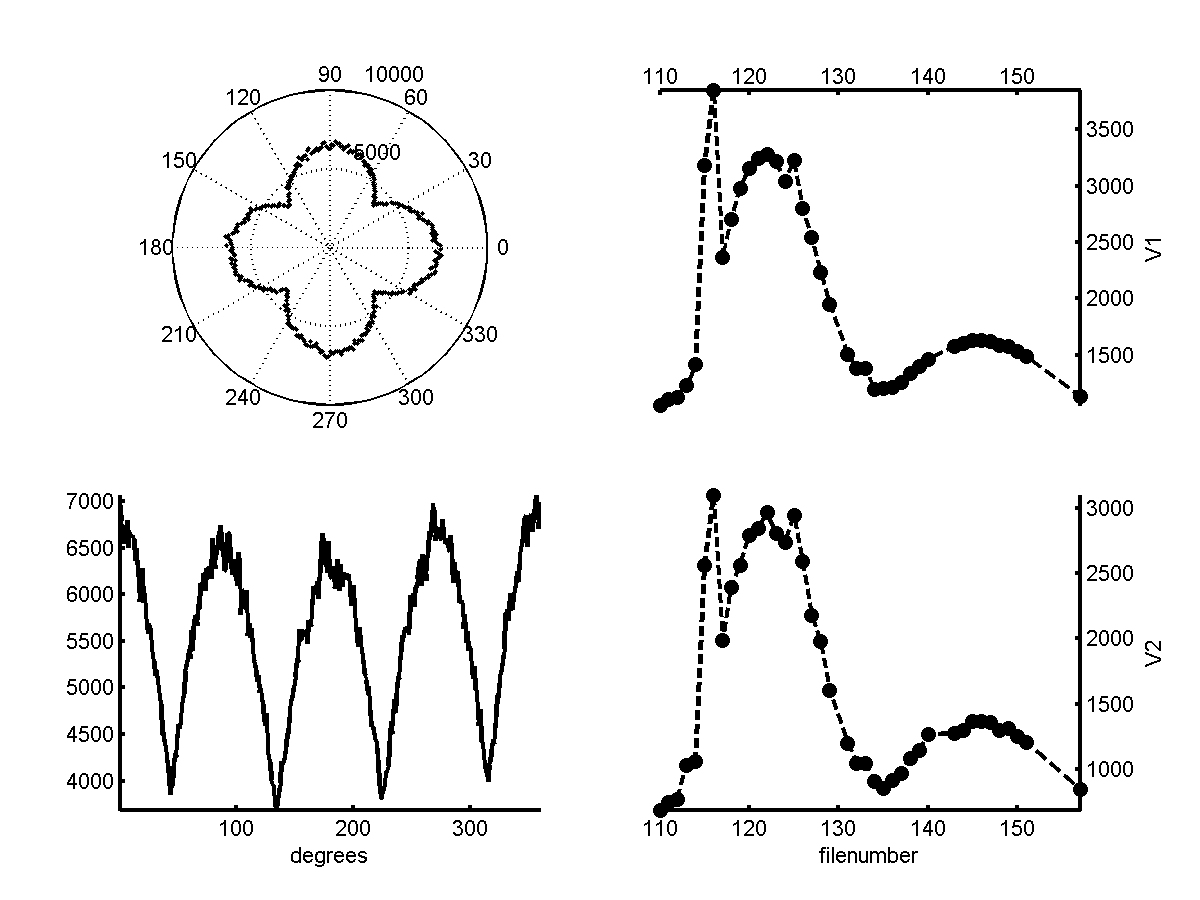
h4=axes('position',[0.1 .55 .35 .35]);
%figure(4);
t=linspace(pi/180,2*pi,360);
polar(t(1:359),AvgBinAngIntensityVec(1:359),'k.')
axis tight;
%title('angular intensity profile 630D13.SPE');
%title(file);
polarch=get(gca,'children');
set(polarch(1),'linewidth',2);
for ii=1:length(polarch)
if strcmp(get(polarch(ii),'type'),'text');
delete(polarch(ii));
end
end %%of ii
%%%
end% inSPE is 3
V1max(inSPE)=max(AvgBinAngIntensityVec(250:300)) - min(AvgBinAngIntensityVec);
V2max(inSPE)=max(AvgBinAngIntensityVec(150:200)) - min(AvgBinAngIntensityVec);
%if inSPE == 350
% figure(5);
if inSPE == 13
h5=axes('position',[0.1 0.1 .35 .35]);
%% t=linspace(pi/180,2*pi,360);
%figure(400 + inSPE);
plot(AvgBinAngIntensityVec(1:359),'k','LineWidth',2)
set(h5,'Box','Off');
%title(file);
axis tight;
xlabel('degrees');
%rose(AvgBinAngIntensityVec,360)
%rose(rosedata,360); % angular intensity profile
end% inSPE is 3
%%%%%%%%%
%%%%%%%%%%~~~~~~~~~~~~
%%%%fancy plotting all in one figure is messed up
%%%% maybe not so useful, not worth my time fixing
%%%%%%%% for now
%~~if ( inSPE <10 )
%~~ypos=(inSPE-1)*.1 +.01 ;
%~~h1=axes('position',[.1 ypos .1 .1]);
%~~end
%~~if ( inSPE > 9 )
%~~ ypos = (inSPE -10)*.1 +.01;
%~~ h1=axes('position',[.5 ypos .1 .1]);
%~~end
%h1=axes('position',[0.1 0.01 .1 .1]);
%%h1=axes('position',[.1 .1 .8 .8]);
% place axes width .8
%height .8 (Max size is 1,1 )
% at (.1,.1) lower left corner is 0,0 and upper right is 1,1
%%%%~~~~~
%plot([1:360],AvgBinAngIntensityVec,'k')
%%%~~~~~~~~~
% fill(t,y,'k')
% plot(t,y)
%~~ set(h1,'xticklabel',' ');
%~~ set(h1,'Box','Off'); %turn enclosing box off
%xh1=get(gca,'xlabel');%get handle of 'xlabel'
%of the current axis and assign to xh1
%set(xh1,'fontsize',16,'fontweight','bold')
%change attributes of 'xlabel'
%set(h1,'xticklabel',' ');
%~~ ylabel(strcat('E= ',num2str(inSPE*1)));
%~~ yh1=get(gca,'ylabel');%%%%%
%~~ set(yh1,'fontsize',8,'fontweight','bold');%%%%%
% set(h1,'xticklabel',' ');
%~~commented out last try
%%%%fancy angular plotting end
%%%%%messed and not fixing right now
%%%~~~~~~~~~~~~~~~~~~~~~~~~~~~~~~~~~~~~~
%%%%%%%%%%%%%%
%%%%%%%%Radial intensity%%%%%%%%%%%begin
%%%%%%
%This script is designed to calculate the Average Radial Intensity
%of a Data Set
%Define File parameters:
%FilePrefix = 'sept13bNoBkg';
%FileSuffix = 'kG';
%fid = fopen('sept13bfilelist.txt');
%FirstFile = 1;
%LastFile = 2;
%Add Scale Factor if necessary since LabView doesn't like
%MatLab scientific notation.
%IsThereScaleFactor = 'N'; %Answer 'Y' or 'N'
%ScaleFactor = 166666;
%Define the center of the image determined from CenterofIntensity.m
%Ycenter = round(xcen);%517;%got x and y mixed up!!
%Xcenter = round(ycen);%503;% should use 512,512
%was off by 9
%fid=fopen('630D13.SPE','r');
%header=fread(fid,2050,'uint16'); %4100bytes/2
%ImMat=fread(fid,1024*1024,'uint16');
%Z=reshape(ImMat,1024,1024);
%fclose(fid);
%Z=double(Z);
%ImageMatrix=Z;
Ycenter = round(ytry); %512
Xcenter=round(xtry); %512
%Now lets find out how many bins there are:
Corner = zeros(1,4);
Corner(1) = sqrt((1-Xcenter)*(1-Xcenter)+(1-Ycenter)*(1-Ycenter));
Corner(2) = sqrt((1024-Xcenter)*(1024-Xcenter)+(1-Ycenter)*(1-Ycenter));
Corner(3) = sqrt((1-Xcenter)*(1-Xcenter)+(1024-Ycenter)*(1024-Ycenter));
Corner(4) = sqrt((1024-Xcenter)*(1024-Xcenter)+(1024-Ycenter)*(1024-Ycenter));
NumofBins = max(Corner);
NumofBins = fix(NumofBins); %truncate to integer
%Now that we know how many bins there are lets divide up
%the image into radial bins to find out average intenisty
%within each bin.
%FirstFile=1;%%%%%%%%%%%%%%%%%%fix this later
%LastFile=1;%%%%%%%%%%%%%%%%%%
%for i = FirstFile:LastFile
% tic; %Start Loop Time
%Load image:
%strFileName = num2str(i);
%FileNum=fgetl(fid);
%FileName = strcat(FilePrefix,FileNum);
%ImageMatrix = imread(strcat(FileName,'.tif'), 'tiff');
%ImageMatrix = double(ImageMatrix);
% ImageMatrix = ImageMatrix'; %DO ONLY IF NECESSARY!!!
% FileIndex = num2str(i);
% FileValue = fgetl(fid);
% FileName = strcat(FilePrefix,'NoBkg',FileValue);
% MatName = strcat(FileName,'.mat');
% load(MatName);
% ImageMatrix = DataMatrix;
% FileIndex = num2str(i);
% MatFieldValue = fgetl(fid);
% FileName = strcat(FilePrefix,MatFieldValue,FileSuffix,FileIndex);
% MatName = strcat('IntCor',FileName,'.mat');
% load(MatName);
% ImageMatrix = ICMatrix;
%Correct with Scale Factor if it exists:
%if IsThereScaleFactor == 'Y'
% ImageMatrix = ScaleFactor * ImageMatrix;
%end
%Now lets look at the radius of each pixel and place it in
%its appropriate bin and then calculate the Average Intensity
%for the radial bin. To reduce the number of calculations
%I will caluclate the radius for each pixel, round it down and then
%declare it the Bin number. So each bin will be one pixel wide.
%%%-------------turn off radial
%%%%%-----------------plot
% figure(500 + inSPE);
BinIntensityVec = zeros(1,NumofBins);
PixelsinBinVec = zeros(1,NumofBins);
AvgBinIntensityVec = zeros(1,NumofBins);
for m=1:1024
for n=1:1024
%Since Matlab doesn't like indicies=zero:
if m==Xcenter & n==Ycenter
continue
end
%Calculate Radius:
Radius = sqrt((m-Xcenter)*(m-Xcenter)+(n-Ycenter)*(n-Ycenter));
%For Bin: truncate to integer, ie Bin 4 runs from 4.000 to 4.999
Bin=fix(Radius);
% BinIntensityVec(Bin)=BinIntensityVec(Bin)+ImageMatrix(m,n);
BinIntensityVec(Bin)=BinIntensityVec(Bin)+cenMatrix(m,n);
PixelsinBinVec(Bin)=PixelsinBinVec(Bin)+1;
end
end
%Now calculate the average Intensity in each Bin:
FileArray = zeros(2,NumofBins);
for j=1:NumofBins;
AvgBinIntensityVec(j)=BinIntensityVec(j)/PixelsinBinVec(j);
FileArray(1,j) = j;
FileArray(2,j) = AvgBinIntensityVec(j);
end
%%%%%%%%%%%%%%%%%%%%%%%%%%%%%%%%%%%%%%%%%%%%%%%%%%%%%%%%
%the radii beyond 512 have fewer and fewer and less reliable
%%data in them. Let us truncate NumofBins to 512
%% not looking too good so change to NumofBins 618
%NumofBins=618;
%NumofBins=580;
%%%%%%%%%%%%%%%%%%%%%%%%%%%%%%%%%%%%%%%%%%%%%%%%%%%%%%%%
% truncate NumofBins
%%%%%%%%%%%%%%%%%%%%%%%%%%%%%%%%%%%%%%%%%%%%%%%%%%%
%%the blocker radius is 125+30
%%%%%%%%%%%%%%%%%%%%%%%%%%%%%%%%%%%%%%%%%%%%%%%%%%%%%%%%
%%NumofBins=700;
%724 default keep it
%in terms of x and y
x=FileArray(1,1:NumofBins);%% x=FileArray(1,:);
y=FileArray(2,1:NumofBins);%%y=FileArray(2,:);
%%%%%%%%%%%%%%%%%%%%%%%%%%%%%%truncated radius***************
%%%%%%%%%%%%%%%%%%%Levenberg-Marquardt non-linear least squares
%%%%fitting to A*exp(-(x-B)^2)/2*C*C) + D*exp(-F*x)
%%%%%%%%%%%%%FWHM=2.35 * C ***p(3)=C D=p(4) F=p(5)
%%%%%%%%%%% B=p(2) A=p(1)/(p(3)*s2p) s2p=sqrt(2*pi)
%%%%%%%%%%%%A=max value B=center of gaussian
% delete above and merge this into main
% function = gaussian plus an exponential (usually exponent
% is zero and the amplitude of exponential gives
%the base line
% leasqr example/test
global verbose
%verbose(1)=0;%%%@@@@@@@@@@@I changed this
%%%%%~~~~~~~~~~~~
%%%%global verbose(1)=1 print intermediate stuff
%%%%global verbose(2)=1 plot
%%%%changed to both zero 1/10/04 was both 1 before
verbose(1)=0;%%%
verbose(2)=0;%%%
%verbose(1) = 1; % normally 1 prints lots of intermediate results
%verbose (2) = 1;
%t=[200:1:700]';% assuming 1 pixel step
%t=[.1:.2:4.7]';
%t = [1:100]';%++++++x data
pin=[max(max(cenMatrix)),350,100,500,0]; %params 1 gauss 1 exponential
%pin=[.6 1 .3 3 .7]';% param guess 2 gaussians 5 param
t=x';%%t=(FileArray(1,:))';%%t=x'
data=y';%%data=(FileArray(2,:))';%%%data=y'
%data=[1 6 28 62 130 165 117 81 36 24 42 29 ...
% 41 45 52 40 25 30 23 10 3 6 2 2]';
%data=data./(.2*sum(data)); % normalize y data
%p = [1; 0.1];
%data = NLleasqrfunc (t, p);%++++++++++++
wt1 = (1 + 0 * t) ./ sqrt (data); % = 1 /sqrt of variances of data
%if (sscanf (version, "%f") < 4)
%% disp ("Used 'rand'");
% rand ("normal");
%++++++++
% data = http://www.geocities.com/evrgallery/data + 0.05 * rand (100, 1) ./ wt1; % 1 / wt1 = sqrt of var = standard deviation
%++++++++++ now supply y data
%else
% disp ("Used 'randn'");
% data = http://www.geocities.com/evrgallery/data + 0.05 * randn (100, 1) ./ wt1;
%endif;
options = [[0.01; 0.01;.01;.01;.01], [.8;.8;.8;.8;.8]];
%options = [[0.01; 0.01], [.8; .8]]; %+++++++
% Note by Thomas Walter :
%
% Using a step size of 1 to calculate the derivative is WRONG !!!!
% See numerical mathbooks why.
%[f1, p1, kvg1, iter1, corp1, covp1, covr1, stdresid1, Z1, r21] = ...
% NLleasqr (t, data, [.8;.05], 'NLleasqrfunc', .001, 50, wt1, [1;1], 'NLleasqrdfdp', options);
% A derivative calculated from central differences needs: step = 0.001...1.0e-8
% And a onesided needs: step = 1.0e-5...1.0e-8 and may be still wrong
%%%%%%%%%~~~~~~~~~~~~~~~~~~~~~~
%%%%% call to NLleasqr next 2 lines
%%%%%%%%~~~~~~~~~~~~~~~~~~~~~~~~~
[f1, p1, kvg1, iter1, corp1, covp1, covr1, stdresid1, Z1, r21] = ...
NLleasqr (t, data, pin, 'NLleasqrfunc', .001, 50, wt1, [0.001 ;.001;.001;.001;.001 ], 'NLleasqrdfdp', options);
% NLleasqr (t, data, [.8;.05], 'NLleasqrfunc', .001, 50, wt1, [0.001;0.001], 'NLdfdp', options);
% used in Xhw632
%[f1, p1, kvg1, iter1, corp1, covp1, covr1, stdresid1, Z1, r21] = ...
% NLleasqr (t, data, pin, 'NLleasqrfunc', .001, 50, wt1, [0.001 ;.001;.001;.001;.001 ], 'NLdfdp', options);
%type Nlleasqr.m
%values of parameters returned are in vector p1 (p one)
height=(p1(1)/(sqrt(2*pi)*p1(3))) + p1(4)*exp(-p1(5)*p1(2)) ;
width=2.3548*p1(3);
peakCenter=p1(2);
HITE(inSPE)=height;
FW(inSPE)=width;
CENTER(inSPE)=peakCenter;
%%~~
if inSPE==350
concatT=strcat(file,'Height= ',num2str(height),' Width= ',num2str(width),' peakCenter= ',num2str(peakCenter));
%concatT=strcat('cntr630D13.SPE Height= ',num2str(height),' Width= ',num2str(width),' peakCenter= ',num2str(peakCenter));
%%%%%-------------turn off radial
% A=height + p1(4);
%s2p=sqrt(2*pi);
C=p1(3); D=p1(4); F=p1(5);
%%%%%%%%%%%%%FWHM=2.35 * C
B=p1(2);
A=(p1(1)/(sqrt(2*pi)*p1(3)));
%%%%%%%%%%%%A=max value B=center of gaussian
yyy=A*exp(-((x-B).^2)/(2*C*C)) + D*exp(-F*x);
figure(6);
plot(x,y,'r*',x,yyy,'k--','LineWidth',3)
title(concatT);
%%legend('azimuthally averaged radial intensity','fitted to a gaussian plus const*exp(0)',0);
end% inSPE is 350
%%~~
%%%%%%%%%%%%%%%%%%%%%%%%%%%%%%%%%%%%%
% figure(3);
% plot(x,y);% plot radial intensity
% plot(FileArray(1,:),FileArray(2,:))
%title('radial intensity 630D13.SPE');%modify to include
% the fit parameters
% print -djpeg99 radialC630D13.jpg;%%%%%%%%%%@@@@@@@@@@@@@@@@
%title('fitted to a1*exp(-(x-c1)/b1)^2 +a2*exp(-b2*x)');
%Finally, save the AvgBinIntensityVec:
%SaveMatName=strcat('RadInt2',FileName,'.mat');
%save(SaveMatName,'AvgBinIntensityVec','BinIntensityVec','PixelsinBinVec');
%SaveTxtName=strcat('RadInt2',FileName,'.txt');
%fidsave=fopen(SaveTxtName,'w');
%fprintf(fidsave,'%g\t %g\n',FileArray);
%fclose(fidsave);
%Status message:
% time = toc;
% time = round(time);
% Looptime = num2str(time);
% Loops=(LastFile-FirstFile+1)-i;
% LoopsLeft=num2str(Loops);
% Status=strcat(FileName,' is Done! Loop Time: ',Looptime,' Loops left: ',LoopsLeft)
%end
%fclose(fid);
%Status = strcat('All Done!')
%%%%%%%%end of Radial intensity%%%%%%%%%%%%%%
%%%%%%%%%%%%%%%%%%%%%%%%%%%
%%%%%%%%%%%%%%%%%%%%%%%%%%%%%%%%%%%%%
%%%autoconvolution%%%%%%%%%%%%%%%%%%%%%%
%%%we really don't need it
%%% we need the fourier transform
% (or the inverse fourier transform ?)
%%%%%==========================autoconvolution====%%%
if inSPE==350
nb=1024;%%==autoconvolution
%nb=2048; %for Big
%%Big=zeros(2048);%##
%for x=1:1024
% for y=1:1024
% Big(512+x,512+y)=cenMatrix(x,y);
% end
%end
%B=Big;
%B=cenMatrix;% TryMatrix centered
%free memory
%free up memorey
clear MaskMatrix;
clear TryMatrix;
clear TryMask;
clear ImageMatrix;
B=cenMatrix;%%==
%reverse conjugate
B=conj(B(nb:-1:1,nb:-1:1));%%==
%use power of 2 transform lengths
nf=2^nextpow2(2*nb);%==
%goodall ran out of memory sooner!!
%bt=fft2(Big,nf,nf);
%was able to get this far and ran out of memory
%reverse conjugate
%B=conj(B(nb:-1:1:nb:-1:1));
at=fft2(B,nf,nf);%%==
%ZZcen=fft2(cenMatrix,nf,nf);%##
bt=fft2(cenMatrix,nf,nf);%%==
%multiply transform then inverse
%ZZcen=fft2(Big,nf,nf);
ZZcen=ifft2(at.*bt);%%==
%make real ouput for real input
if ~any(any(imag(cenMatrix))) & ~any(any(imag(B)))
ZZcen = real(ZZcen);%%==
end%%==
clear cenMatrix; clear B; %%==
%trim
ZZcen(2*nb:nf,:)=[];%##
ZZcen(:,2*nb:nf)=[];%##
clear cenMatrix;%##
%%ZZcen=ifft(ZZcen,nf,nf);
%[X,Y]=meshgrid(1:4096,1:4096);
%%##[X,Y]=meshgrid(1:2048,1:2048);%##
[X,Y]=meshgrid(1:2047,1:2047);%%==
%[X,Y]=meshgrid(1:1024,1:1024);
%figure(3);
%ZZ=conv2(Z,Z); this ran more than half hour & had to be killed
%mesh(X,Y,ZZ);
%view(90,90);
%axis square;
%figure(6);
%axis square;
%contourf(X,Y,ZZ);
%view(90,90);
%hold on;
%shading flat;
%vf=(10^13)*linspace(1,3,150);%changed 50 -> 150
%[cf,hf]=contour(X,Y,ZZcen,vf);
figure(7);%%==
maxVal=max(max(ZZcen));
minVal=min(min(ZZcen));
diffVal=maxVal-minVal;
%%vf=linspace(minVal,maxVal,100);%%==last one used
vf=linspace(minVal + .25*diffVal,minVal+.3*diffVal,50);
%%%.25,.30,50 is best so far%%===
%%vf=(10^13)*linspace(1,3,100);
%vf=(10^13)*linspace(1,3,50); %%beautiful but not 4 fold (2 fold)
[cf,hf]=contour3(X,Y,ZZcen,vf);
colormap(gray);
%%colormap(bone);
axis square;
%contourf(X,Y,ZZcen);
axis tight;
view(90,90);
%hold on;
%shading flat;
%vf=(10^13)*linspace(.75,1.75,20);
%[cf,hf]=contour(X,Y,ZZcen,20);
%clabel(cf,hf);
%colorbar;
%view(90,90);
%title('autoconvolution 630D13.SPE adjusted');
%clabel(cf,hf);
%colorbar;
%%##mesh(X,Y,ZZcen)
%%contour(X,Y,ZZcen);
%%axis square;%%==
%%view(90,90);%%==
concatT=strcat('contour autocorrelation perpendicular to z axis ', file);
%%title(concatT);%%====
%%colorbar;%%==========
print -djpeg99 Fig7145.jpg
print -deps phig7145.eps%%===
%%==
end%%if inSPE==350
if inSPE == 350
figure(8);%%==
mesh(X,Y,ZZcen);%%==
axis square;
concatT=strcat('3D autocorrelation ',file);
%%%title(concatT);%%====
clear ZZcen; %%== freeup some memory
end%%== inSPE is 350
%%%%===============
%%##figure(12);%##
%vf=(10^5)*linspace(1,3,50);%changed 150 -> 50
%meshc(X,Y,abs(ZZcen));
%ZZcen(1,1)=0;%this didn't help
%ZZcen(2047,2047)=0;% still have spikes
%ZZcen(2047,1)=0;%on four corners
%ZZcen(1,2047)=0;
%%##ZZcen=fftshift(ZZcen);%##
%%##ZZcen=ZZcen/(2047*2047);%##
%%##ZZcen=abs(ZZcen);%## set ZZcen = to its absolute value
%for x=1000:1049 % take out centr hump
% for y=1000:1049% cnetered on 1024,1024
% ZZcen(x,y)=0;
% end
%end
%%RFT=100;%## central blocker in fourier transform
%%%same effect as threshold
%RFT=120,60,100,55,50,45,40;35,30,25,20
%%for x=1:2047%##
%% for y=1:2047
%% if ((x-1024)*(x-1024)+(y-1024)*(y-1024)) < RFT*RFT
%% ZZcen(x,y)=0;
%%end%if
%%end%y
%% end%x%##
%Thresh=5 .* 10^7.* zeros(2047);
%fThresh=find( ZZcen > Thresh);
%ZZcen(fThresh) =0;% set those values of
% ZZcen that are greater than Thresh
% equalto zero and plot
%%% 10/15/03 no plot of fftb
%%%mesh(X,Y,ZZcen);%##
%view(90,90);%##
%axis square;
%contour3(abs(ZZcen));
%waterfall(real(ZZcen));
%contour(X,Y,abs(ZZcen));
%[cf,hf]=contour3(X,Y,abs(ZZcen),vf);
%mx=max(max(ZZcen)); % computer went crazy
%mesh(X,Y,abs(ZZcen)./mx);
%vf=(10^9)*linspace(0.001,.2,50);
%[cf,hf]=contour(X,Y,abs(ZZcen),vf);% drove the computer carzy
%contour3(X,Y,ZZcen,vf);
%view(90,90);
%axis square;%##
%title('DC blocked modulus fourier Transform adjusted630D13.SPE/(2047*2047)');
% print -djpeg99 FT630D13.jpg
%title('autoconvolution Big630D13.SPE adjusted and centered');
%figure(13);
%mesh(X,Y,real(ZZcen));
%view(90,90);
%colorbar;
%axis square;
%title('real part of inverse fourier Transform Big630D13.SPE')
%print -djpeg99 Aout3.jpg
%%%%%%%%%%%%%%%
%now top and bottom
%intensity should be smoothed. Let's see
%%%%%%%%%%%final TryMatrix
%figure(18);
%[X,Y]=meshgrid(1:1024,1:1024);
%mesh(X,Y,TryMatrix);
%axis square;
%view(90,90);% looks like Winview
%title('630D13.spe corrected hotspots,part of blocker,right,top & bottom');
%print -djpeg99 Ain1.jpg
%%%%%%%%%%%%%%%end corrections hotspots,blocker,far right,top bottom%%%
%%%%%%%%%%%%%%%%%%%%%%%%%%%%%%%%%%%%%
%%%%%%%%%%%%%%%%%%%%%%%to do%%%%%%%%%%%%%%
%assuming one maximum; sometime should fix it so
% the outermost maximum is used
%Ndrop=0;%%number of points out of 360 to drop
%Ncircle=360-Ndrop;
%zp=zeros(1,Ncircle);
%xp=zeros(1,Ncircle);
%yp=zeros(1,Ncircle);
%for ip=1:Ncircle % Ncircle maximums
% zp(ip)=zs(is(ip+Ndrop));
% xp(ip)=xi(is(ip+Ndrop));
% yp(ip)=yi(is(ip+Ndrop));
%end % ip
%figure(7);
%plot(xp,yp,'o') % plot the Ncircle points on the circumference
%view(90,90);
%axis square;
%title('around circle of radius R');
%%%%%%%%%%%%%=======%%%%%%%%%%%%%%%%%%%%%%%%======%%%%%%%%%%%%%%%
%the above could be streamlined
%%%%%%%%%%%%%+++++++++++++%%%%%%%%%%%%%%%%%%+++%%%%%%%%%%%++%%%
%sumint=0.;
%sumx=0.;
%sumy=0.;
%for ict=1:Ncircle % use the 200 angles
% ith=is(ict);
% sumrx=0.;
% sumry=0.;
% sumrint=0.;nb=1024;
%B=TryMatrix;% TryMatrix
%reverse conjugate
%B=conj(B(nb:-1:1,nb:-1:1));
%use power of 2 transform lengths
%nf=2^nextpow2(2*nb);
%at=fft2(B,nf,nf);
%bt=fft2(TryMatrix,nf,nf);
%multiply transform then inverse
%ZZ=ifft2(at.*bt);
%make real ouput for real input
%if ~any(any(imag(TryMatrix))) & ~any(any(imag(B)))
% ZZ = real(ZZ);
%end
%trim
%ZZ(2*nb:nf,:)=[];
%ZZ(:,2*nb:nf)=[];
%[X,Y]=meshgrid(1:2047,1:2047);
%[X,Y]=meshgrid(1:1024,1:1024);
%figure(3);
%ZZ=conv2(Z,Z); this ran more than half hour & had to be killed
%mesh(X,Y,ZZ);
%view(90,90);
%axis square;
%figure(5);
%axis square;
%contourf(X,Y,ZZ);
%view(90,90);
%hold on;
%shading flat;
%vf=(10^13)*linspace(.75,1.75,20);
%[cf,hf]=contour(X,Y,ZZ,20);
%clabel(cf,hf);
%colorbar;
%view(90,90);
%title('autoconvolution 630D13.SPE adjusted');
%now top and bottom
%intensity should be smoothed. Let's see
%figure(18);
%[X,Y]=meshgrid(1:1024,1:1024);
%mesh(X,Y,TryMatrix);
%axis square;
%view(90,90);% looks like Winview
%title('630D13.spe corrected hotspots,part of blocker,right,top & bottom');
%%%%%%%%%%%%%%%end corrections hotspots,blocker,far right,top bottom%%%
%%%%%%%%%%%%%%%%%plotting of original%%%%%%%%%%%%%%%%%%%%%
%figure(19);
%[X,Y]=meshgrid(1:2047,1:2047);
%[X,Y]=meshgrid(1:1024,1:1024);
%mesh(X,Y,Big);
%mesh(X,Y,cenMatrix);
%axis square;
%view(90,90);% looks like Winview
%title( ' Big 630D13.SPE ');
%title('centered 630D13.spe corrected hotspots,blocker arm,right,top & bottom');
%print -djpeg99 Ain3.jpg % saves to file with highest quality jpg
%%%%%%%%%%%%%%%%%%%%%%%%%%%%%%%%%%%%%
%%%%%%%%%%%%%%%%%%%%%%%to do%%%%%%%%%%%%%%
%assuming one maximum; sometime should fix it so
% the outermost maximum is used
%Ndrop=0;%%number of points out of 360 to drop
%Ncircle=360-Ndrop;
%zp=zeros(1,Ncircle);
%xp=zeros(1,Ncircle);
%yp=zeros(1,Ncircle);
%for ip=1:Ncircle % Ncircle maximums
% zp(ip)=zs(is(ip+Ndrop));
% xp(ip)=xi(is(ip+Ndrop));
% yp(ip)=yi(is(ip+Ndrop));
%end % ip
%figure(7);
%plot(xp,yp,'o') % plot the Ncircle points on the circumference
%view(90,90);
%axis square;
%title('around circle of radius R');
%%%%%%%%%%%%%=======%%%%%%%%%%%%%%%%%%%%%%%%======%%%%%%%%%%%%%%%
%the above could be streamlined
%%%%%%%%%%%%%+++++++++++++%%%%%%%%%%%%%%%%%%+++%%%%%%%%%%%++%%%
%sumint=0.;
%sumx=0.;
%sumy=0.;
%for ict=1:Ncircle % use the 200 angles
% rthmax=ceil(sqrt(xp(ict)*xp(ict)+yp(ict)*yp(ict)));
% for rth=nrmax:-1:rthmax % in toward center on a ray
%%%%%%%%%%%%%%%%%%%%%%% begin here
% xith(rth)=ceil(xtry+rth*sin(ith*2*pi/360));
%round up to nearest integer
% yith(rth)=ceil(ytry-rth*cos(ith*2*pi/360));
% zith(rth)=ImageMatrix(xith(rth),yith(rth));
% sumrint=sumrint+rth*zith(rth);
%replace this
% sumrx = sumrx+zith(rth)*rth*rth*sin(ith*2*pi/360);
% sumry = sumry-zith(rth)*rth*rth*cos(ith*2*pi/360);
% end%rth
% sumx=sumx+sumrx;
% sumy=sumy+sumry;
% sumint=sumint+sumrint;
% end% ith
%centerx=xtry + sumx/sumint;
%centery=ytry + sumy/sumint;
%it seems only natural to use square boxes instead of radius
% so call the previous centroidR.m and use x and y
% forget the theta=192-196 check this again
%so 200 radial angles->less
% region of integration(summation) is in toward center on a ray until
% the maximum and omitting the blocker rays and ccd damaged rays
%the acts like it has a smaller area than 1024x1024
%seems to be rectangle 1<=x<=985 and 12<=y <=1020
%refine these numbers later
%
%%%%%%%%%%%%timing
end%
end % inSPE
toc
%%%angular plot of V1max (highest max) and V2max
%%%measure of magnetocrystalline anisotropy
%figure(25);
h25=axes('position',[.55 .55 .35 .35]);
plot(filenum,V1max,'--ko','Linewidth',2,'MarkerFaceColor','k');
set(h25,'Box','Off');
set(h25,'yaxisloc','right');
set(h25,'xaxisloc','top');
%%xlabel('filenumber');
ylabel('V1');
axis tight;
%title('first maximum angular intensity ');
%print -djpeg99 Fig25.jpg
h26=axes('position',[.55 .1 .35 .35]);
%figure(26);
plot(filenum,V2max,'--ko','Linewidth',2,'MarkerFaceColor','k');
set(h26,'Box','Off');
set(h26,'yaxisloc','right');
xlabel('filenumber');
ylabel('V2');
%title('second maximum angular intensity ');
%print -djpeg99 Fig26.jpg
axis tight;
%%%radial plots of
%%height
%%(1/FWHM) proportional to correlation between
%%% neighboring domains(?)
%%%center of gaussian measure of domain spacing
%%%
%figure(27);
%plot(filenum,HITE,'--k*','LineWidth',3)
%title('height of peak');
%print -djpeg99 Fig27.jpg
%figure(35);
%plot(filenum,1./FW,'--k*','Linewidth',3)
%title(' inverse of FWHM');
%print -djpeg99 Fig35.jpg
%figure(45);
%%==plot(filenum,CENTER,'--k*','Linewidth',2)
%plot(filenum(2:length(filenum)),CENTER(2:length(CENTER)),'--k*','Linewidth',3)
%title(' center of peak');
%print -djpeg99 Fig45.jpg
%figure(46);
%plot(filenum(2:length(filenum)),1./CENTER(2:length(CENTER)),'--k*','Linewidth',3)
%title(' inverse of center of peak');
print -djpeg99 evrFig2.jpg
print -deps evrFig2.eps
print -dmfile mfileOfevrFig2.m
%%%the end