 |
|
|
|
|
|
|
|
|
|
|
|
|
|
|
|
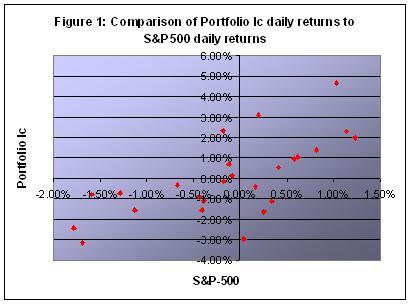
| Initial review of the distribution of daily portfolio returns compared to S&P-500 daily returns showed that the portfolio might exhibit some kind of "multiple-beta" behavior. That is, the portfolio appears to respond to up-market days with one beta, while responding to down-market days with a different beta. Figure 1 intimates that the portfolio beta for positive returns may be larger than the beta for negative returns. This would imply that the portfolio, while not exhibiting zero-beta behavior, nevertheless is self-hedging in that it responds more to up-market days than to down-market days. |
|
|
|
 |
|
|
|
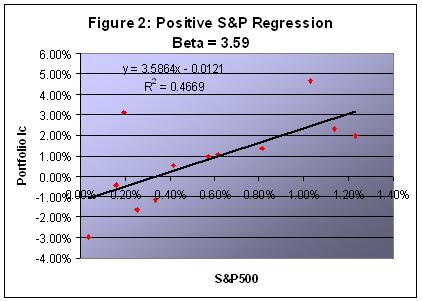
In order to determine whether or not the portfolio does, in fact, exhibit multiple-beta behavior, the data sample was divided into two groups: positive S&P500 returns, and negative S&P500 returns. Simple regression was done on each sample to determine their respective betas. Figure 2 displays the regression and beta for the positive sample, while figure 3 shows the regression and beta for the negative sample. |
|
|
|
 |
|
|
|
 |
|
|
|
Next, the betas were evaluated with a paired t-test in order to test the null hypothesis: |
|
|
|
 |
|
|
|
Where Beta-p is the slope for the positive return sample and Beta-n is the slope for the negative return sample. The test assumes that the observations in the data exhibit normally distributed errors with no serial-correlations (the assumptions were not verified). The result was that the null hypothesis was rejected at a 77% confidence level. (That is, the betas are statistically different at the 77% confidence level).
While the hypothesis rejection is not truly certain, the results are certainly encouraging, and warrant further observation of the portfolio's behavior. I will continue to collect data on the portfolio and attempt this test at a later date, with larger data samples; and if the results are still optimistic, a full statistical evaluation will be performed. |
|