To believe that Bush won in 2004 you
must also believe that…
Updated June 11, 2008
Do you believe the Final NEP? If so, you
must also believe that there were 6 million returning phantom Bush voters from
2000.
|
|
Cast |
Recorded |
Alive |
Voted |
2004 |
Cast |
Vote
shares required to match recorded vote |
|||
|
2000 |
2000 |
2000 |
2004 |
2004 |
Turnout |
Mix |
Kerry |
Bush |
Other |
Turnout/Alive |
|
DNV |
- |
- |
- |
- |
20.79 |
17.0% |
54% |
44% |
2% |
- |
|
Gore |
55.06 |
51.00 |
48.45 |
47.48 |
45.25 |
37.0% |
90% |
10% |
0% |
93.4% |
|
Bush |
51.76 |
50.46 |
47.93 |
46.97 |
52.59 |
43.0% |
9% |
91% |
0% |
109.7% |
|
Other |
4.01 |
3.96 |
3.76 |
3.69 |
3.67 |
3.0% |
64% |
14% |
22% |
97.5% |
|
Total |
110.83 |
105.42 |
100.15 |
98.14 |
122.30 |
100% |
48.27% |
50.73% |
1.00% |
-2.46% |
|
|
Cast |
Recorded |
|
|
|
Total |
59.03 |
62.04 |
1.22 |
-3.01 |
|
Gore |
49.68% |
48.38% |
|
|
|
Recorded |
48.27% |
50.73% |
1.00% |
-2.46% |
|
Bush |
46.70% |
47.86% |
|
|
|
122.30 |
59.03 |
62.04 |
1.23 |
-3.01 |
|
|
|
Cast |
Recorded |
Alive |
Voted |
2004 |
True Vote |
12:22am
NEP Vote shares |
|
||
|
2000 |
2000 |
2000 |
2000 |
2004 |
2004 |
Turnout |
Mix |
Kerry |
Bush |
Other |
Turnout/Alive |
|
True Vote |
DNV |
- |
- |
- |
- |
22.56 |
15.6% |
57% |
41% |
2% |
- |
|
49.53% |
Gore |
54.89 |
51.00 |
52.14 |
51.10 |
51.10 |
41.8% |
91% |
8% |
1% |
98.0% |
|
46.71% |
Bush |
51.77 |
50.46 |
49.18 |
48.20 |
48.20 |
39.4% |
10% |
90% |
0% |
98.0% |
|
3.76% |
Other |
4.17 |
3.96 |
3.96 |
3.88 |
3.88 |
3.2% |
64% |
17% |
19% |
98.0% |
|
|
Total |
110.83 |
105.42 |
105.28 |
103.18 |
125.74 |
100% |
52.91% |
45.76% |
1.33% |
7.15% |
|
|
|
Cast |
Recorded |
|
|
|
Total |
66.53 |
57.54 |
1.68 |
8.99 |
|
|
Gore |
49.53% |
48.38% |
|
|
|
Recorded |
48.27% |
50.73% |
1.00% |
-2.46% |
|
|
Bush |
46.71% |
47.86% |
|
|
|
122.30 |
59.03 |
62.04 |
1.23 |
-3.01 |
What does the following table tell us?
Even if just 64% of Gore 2000 voters and 90%
of Bush 2000 voters returned in 2004, Gore still won by 700,000 votes. In order
for Bush to win his 3.0 million recorded vote margin, he needed a 97% turnout
of Bush 2000 voters (still living) and a 64% Gore voter turnout. If you believe
that, there is a great Chinese restaurant in lower Manhattan near a famous old
bridge that’s for sale.
Sensitivity Analysis
|
Bush |
|
Kerry
Share |
|
|
|
|
Turnout |
|
Gore
Turnout |
|
|
|
|
52.9% |
64% |
73% |
80% |
96% |
98% |
|
90% |
49.5% |
50.8% |
51.8% |
54.1% |
54.4% |
|
92% |
49.1% |
50.4% |
51.4% |
53.8% |
54.0% |
|
94% |
48.7% |
50.0% |
51.1% |
53.4% |
53.7% |
|
96% |
48.4% |
49.7% |
50.7% |
53.0% |
53.3% |
|
98% |
48.0% |
49.3% |
50.3% |
52.6% |
52.91% |
|
|
|
|
|
|
|
|
Bush |
|
Kerry
Margin |
|
|
|
|
Turnout |
|
Gore
Turnout |
|
|
|
|
9.0 |
64% |
73% |
80% |
96% |
98% |
|
90% |
0.7 |
3.9 |
6.4 |
12.2 |
12.9 |
|
92% |
(0.3) |
2.9 |
5.4 |
11.2 |
11.9 |
|
94% |
(1.3) |
1.9 |
4.5 |
10.2 |
10.9 |
|
96% |
(2.3) |
1.0 |
3.5 |
9.2 |
10.0 |
|
98% |
(3.2) |
0.0 |
2.5 |
8.3 |
9.0 |
1- The media exhaustively analyzed state and national pre-election /exit
poll data and the documented evidence of vote suppression and miscounts.
But raw exit poll precinct data has never been made public.
2- There are many
explanations as to why the exit polls were wrong. But none are
supported (and some are refuted) by the evidence: Kerry voters were more
approachable to be interviewed; Bush voters were reluctant to be interviewed;
interviewers sought out Kerry voters;
returning Gore voters told exit pollsters that they voted for Bush in
2000; exit polls are not random
samples; exit polls in the U.S. are not designed to catch election fraud; early
polling overstated the Kerry vote; women voted early; Republicans voted late; Gore voters defected to Bush at twice the
rate that Bush voters defected to Kerry, etc.
3- The votes were
fairly counted. But 2004
U.S. Census data indicates that 125.7 million votes were cast as opposed to
the 122.3m recorded. And investigative reporter Greg Palast presented government data which documented 3
million uncounted votes.
4- Democrats failed to attract first-time
voters. But according to the National Exit Poll, since 1992 the
Democrats have won first-time voters by a 14% average margin. Ruy Teixeira
wrote about it in The Emerging Democratic Majority.
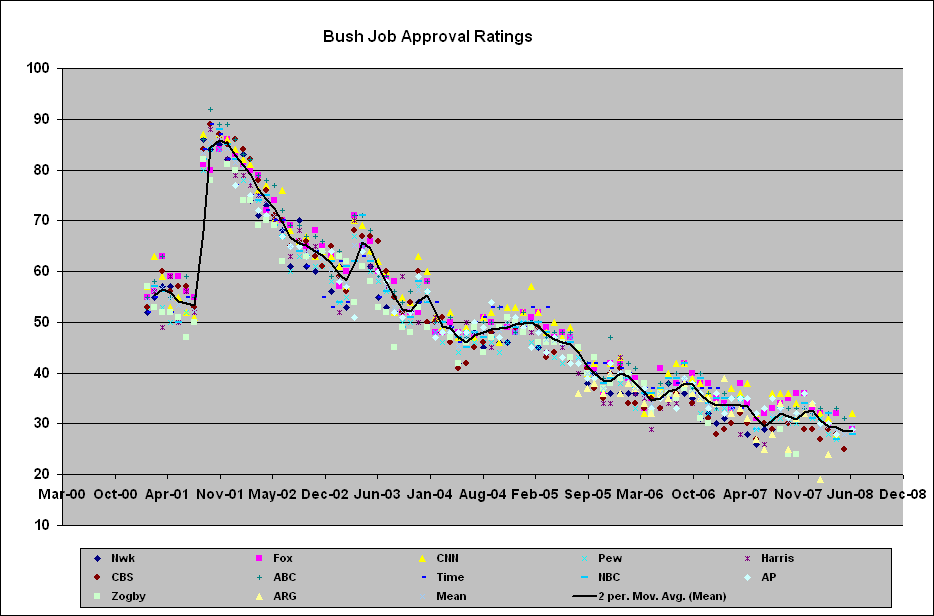
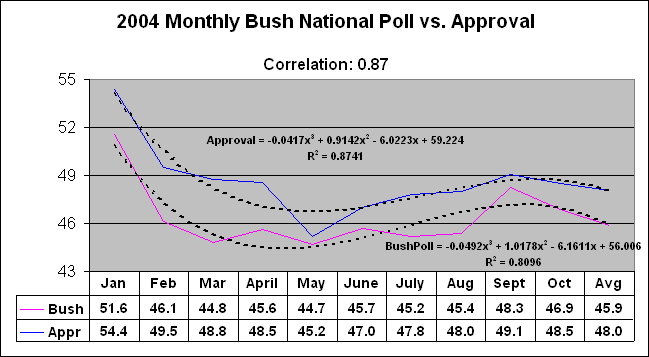
5- Bush’s 48.5%
Election Day approval
rating was not a major factor.
But since 1976 all presidential incumbents with less than 50% approval lost
re-election (Ford, Carter, Bush I) while those above 50% won (Eisenhower,
Johnson, Nixon, Reagan, Clinton). And there was a near-perfect 0.87 correlation between Bush’s monthly approval rating and
the average national poll. The correlation was confirmed when Kerry won the
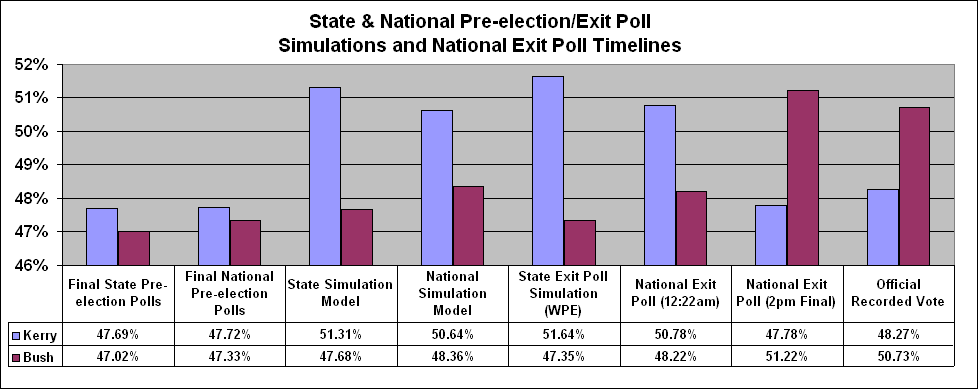
12:22am National Exit Poll by 51-48%.
6- Bush gained 9% over
his 2000 vote in heavily Democratic urban locations and lost 3% in highly
Republican small towns and rural areas. But it’s an Urban
Legend.
7- There is no
evidence that the vote count was corrupted. But how did Bush win
51.5% of the first 115.8m recorded
votes while Kerry won 54.6% of the final
5.3m, a 500,000 vote decline in the Bush “mandate”.
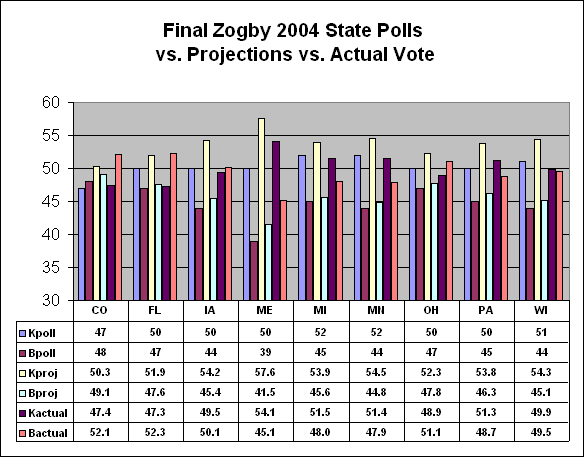
8- Final pre-election
polls did not match the exit polls. But after undecided voters were allocated, pre-election state (Kerry
47.9-Bush 46.9%) and national (Kerry 47.2-Bush 46.9%) polls closely matched the
national (50.8-48.2%) and state (51.8-47.2%) exit polls. The final Zogby
battleground state polls showed Kerry leading in 9 critical states.
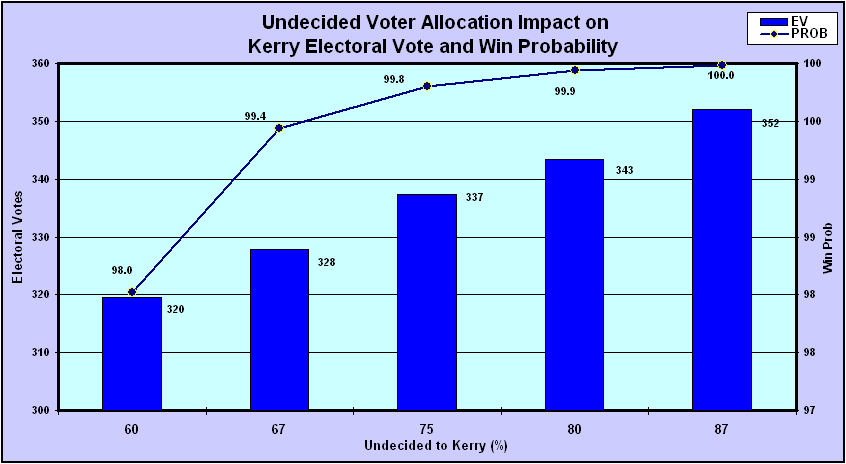
9- Bogus assumptions were used in the
pre-election Election Model
simulation model which forecast that Kerry would win 320-337 electoral
votes. But the only
input assumption was that Kerry would capture at least 60% of the undecided
vote. The Election Model popular and electoral vote projections were confirmed
by state and national exit poll analysis in the Interactive
Election Simulation Model.
10- There is no
evidence that undecided voters break for the challenger. Historical
evidence indicates that undecided voters break for the challenger over 80% of
the time - especially when the incumbent is unpopular - and Bush had a 48.5%
average approval rating. World-class pollsters Harris
and Zogby reported
their late polling indicated Kerry would win 60-80% of the undecided vote. The
National Exit Poll said Kerry won 55-60%.
11- Bush was leading
in the final pre-election polls.
Not so. Kerry led Bush by less than 1% in the state-weighted average vote and held a 3% lead after allocation of
undecided voters. Kerry and Bush were tied at 47% based on the final national
18-poll average.
12- Non-response bias
in the exit
polls was the reason why 43 states red-shifted to Bush.
But 3 million votes (mostly from heavily Democratic minority districts)
were never counted - and Kerry won 70-75%.
Response rates were lowest in Kerry urban strongholds.
13- It was just a
coincidence that Oregon was the only battleground state which shifted to Kerry. But Oregon is also the only state which
votes exclusively by paper mail ballots and the shift was a fraction of one
percent. Any discrepancy would be minimal and favor either Bush or Kerry.
14- There is nothing
suspicious in the fact that six of the eight states which deviated to Kerry from
the exit polls were strong Bush states. But the exit poll discrepancies were all within the margin of
error.
15- Final exit polls are always matched to the
recorded vote. But this assumes a fraud-free election and no
uncounted votes. And since 2000, elections have been anything but fraud-free.
Therefore, the final exit polls (state and national) cannot be correct.
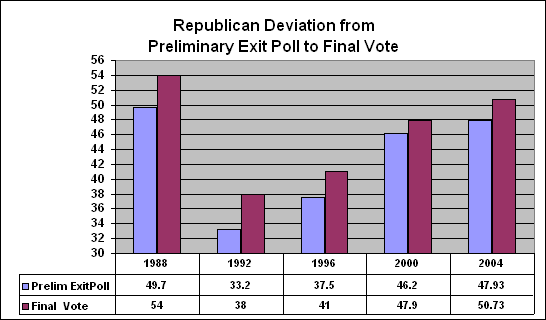
16- There are
reasonable explanations why Kerry led the National Exit Poll by 51-48% at 4pm
(8349 respondents), 7:30pm (11027) and 12:22am (13047) and Bush won the 2pm
Final NEP (13660) by 51-48%. But why do they defy the Law of Large
Numbers and the Central Limit Theorem?
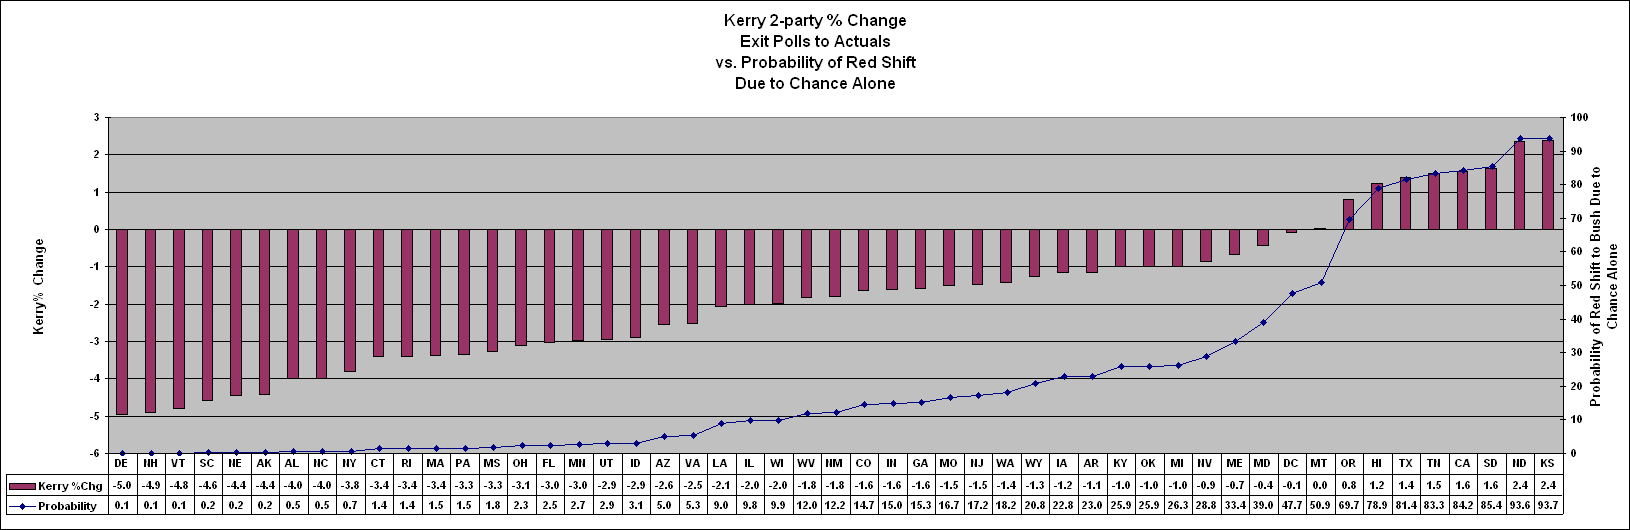
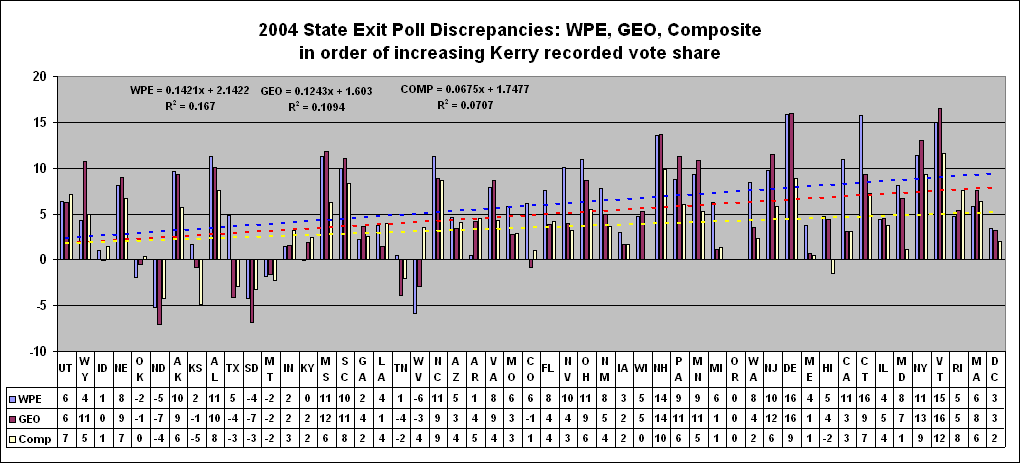
17- The margins of
error used to calculate probabilities
of exit poll discrepancies were too low. But even assuming a 60%
“cluster effect”, the probabilities were near zero. Assuming a zero cluster effect, WPE-adjusted state exit poll discrepancies
exceeded the MoE in 29 states for Bush and just one for Kerry. Assuming a 30%
cluster, the margin of error in was exceeded in 24 states for Bush. Composite (12:22am) exit poll discrepancies
exceeded the margin of error in 16 states for Bush; none for Kerry.
18- There is nothing
suspicious about the fact that all 21 Eastern Time Zone states red-shifted from
the exit poll in favor of Bush. But 14 deviated beyond the margin of
error with virtually ZERO probability.
19- Exit polls are not
true random samples. But Edison-Mitofsky state in the National
Exit Poll Notes and the NEP
Methods Statement that respondents
were randomly-selected and the overall margin of error was 1%.
20- Bush voters were
reluctant to respond to exit pollsters. But this was contradicted by
the Final Exit Poll, which stated that Bush 2000 voters comprised 43% of the
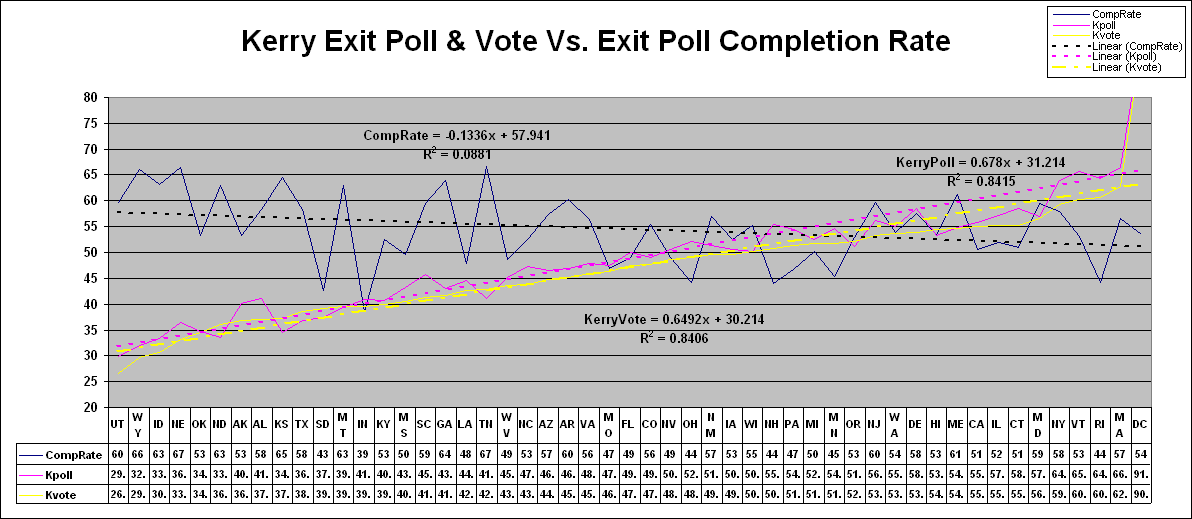
respondents, as compared to 37% for Gore voters. It was also contradicted by a linear
regression analysis: non-response rates increased going from the strongest
Bush states to the strongest Kerry states which suggests that non-responders
were Kerry voters.
21- The Final Exit
Poll was correct in matching to the Bush 51-48% win. But the 43/37 weights indicate that
either Bush voters were over-polled or the Final was rigged - a classic Hobson
Choice. In any case, the rBr hypothesis was debunked.
22- False recall (of
Gore voters) is a valid explanation for the Final NEP “Voted in 2000” weights. But
Bush 2000 voters could not have comprised 43% (52.6m) of the 122.3m votes
recorded in 2004; Bush only had 50.5m votes in 2000. Furthermore, approximately 1.8m Bush 2000 voters died prior to
the 2004 election, so 48.7m was the maximum who could have voted assuming 100%
turnout in 2004.
23- Although the Final
NEP Bush/Gore weightings were impossible, the DU
Game thread showed that Bush could have achieved his vote assuming feasible
weights. But to compensate
for the feasible weights, Bush vote shares had to be inflated to implausible
levels to match the recorded vote.
24- This is how Bush won by 3 million votes:
14.6% of Gore voters defected to Bush in 2004; only 7.2% of Bush voters
defected to Kerry; Kerry won just 52.9% of new voters. But
according to the NEP, Kerry captured 10% of Bush 2000 voters while Bush won
just 8% of Gore voters; Kerry won 57% of new voters and 71% of Nader voters.
25- False recall is a
valid argument to explain the Final NEP 43/37 weights. But false
recall is not a factor in pre-election polls. And the pre-election polls (after
undecided voters were allocated) matched the exit polls.
26- An NES study
suggests that a significant percentage of Gore voters told exit pollsters they
voted for Bush in 2000. But only 3200 of 13047 NEP respondents were
asked how they voted in 2000. Kerry won
the other 10,000 by 51-48%.
27- Returning Gore voters misrepresented their 2000 vote because
they wanted to be associated with the winner - Bush. But Bush had
48% approval on Election Day. The majority of new voters were Democrats and
Independents; they gave Bush a 25-30% approval
rating. And Gore was the official
“winner” in 2000 - by 540,000 votes.
28- Bush found 12
million new voters in 2004. But simple arithmetic shows he needed
more than 16 million. Bush had 50.5m recorded votes in 2000. Approximately 2.5m
died (assuming 1.2% annual voter mortality) and 2.4m did not vote in 2004
(assuming 95% turnout). Therefore, approximately 45.6m Bush 2000 voters turned
out to vote. Bush needed over 16 of 25m new voters (64%) to go from 45.6m to
62m. But according to the 12:22am National Exit Poll, he won 41% - a 23%
difference.
29- Bush won by 3
million votes. But how could that be? According to the NEP, Kerry
won 57% of new voters (first-timers by 55-43% and other new voters by 61-37%);
he won returning Nader voters by 70-20%. Kerry won 10% of Bush voters while
just 8% of Gore voters defected to Bush.
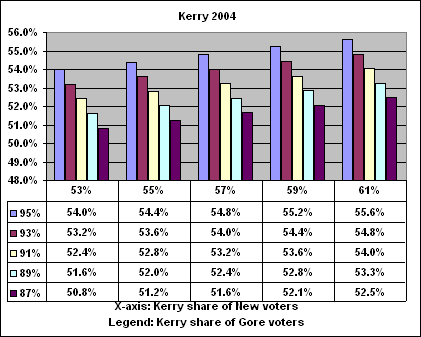
30- The sensitivity analysis
which showed that Kerry won all plausible scenarios is overkill and does not
prove anything. But given the adjusted 12:22am Composite vote shares
and assuming 100% Bush 2000 voter turnout, Kerry needed just 73% turnout of
Gore voters to tie Bush. Gore voter turnout had to be 64% in order for Bush to
match his recorded vote margin. Using pristine, non-adjusted exit poll
shares, required Gore voter turnout was even lower than above.
31- Bush’s share of
females increased by 4.2%. But how did his share of the male vote
decline by 0.2%? Females voted 54-45% for Kerry; Blacks voted over 90% for him;
he won Independents by 52-44%.
32- Bush won Ohio. But there is plenty of documented evidence of uncounted and
switched votes, besides massive voter disenfranchisement. Two election workers were convicted of
rigging the recount. Fifty-six of 88
county voting records were destroyed. The final Zogby poll had Kerry leading by
50-47%. Kerry led the pristine Ohio exit poll by 54.1-45.9% (based on the
average 10.9% precinct WPE). He even
led the adjusted 12:22am Composite by 52.1-47.9%.
33- Bush won Florida
by 52-47% (a 368,000 vote margin) even though the Democrats had a 41-37%
registration advantage in Touch Screen (TS) counties and a 42-39% edge in
Optical Scan (OS) counties. But Kerry won TS counties (3.86mm votes)
by 51-47% and Bush won OS counties (3.43mm votes) by a whopping 57-42%. The
Final Zogby Florida pre-election poll had Kerry leading by 50-47%. Kerry won the exit poll by 50.9-48.3%. In 2000, Gore won 70% of 180,000 uncounted
under/over votes. If counted, he would
have won by at least 60,000 votes. Dan Rather's expose on voting machines proved that poor-quality paper used in Florida punch
card machines was a major cause of spoilage in heavily Democratic precincts.
34- The New York
pre-election poll matched the recorded vote (59-40%), while the exit poll was
wrong (64.1-34.4%). But even if the exit poll was off (which it
wasn’t), the 5% discrepancy is not significant. The margin of error for the 600-sample
pre-election poll was 4%; there was a 95% probability that Kerry's vote could
have been anywhere between 55-63%.
Assuming a 30% cluster effect, the exit poll MoE was 3.2%; there was a
95% probability that Kerry's vote was between 60.9-67.3%. Therefore, a Kerry
vote in the 60.9-63.0% range would fall within the margin of error of both
pre-election and exit poll.
35- The NY 2004 recorded vote was fraud-free;
lever voting machines are foolproof. But this implies that 100% of
returning Nader 2000 voters defected to Bush. In 2000, the NY vote was Gore 60.5-Bush 35.4-Nader 4.1. According to the
2004 NEP Composite (12:22am), Kerry won Nader voters by 71-21%; 10% of Bush
voters defected to Kerry; 8% of Gore voters defected to Bush. And Kerry did
better in NY than he did elsewhere. Kerry won NY by 63-36% using weights based
on the NY 2000 recorded vote, assuming his vote shares were two percent higher
than in the NEP. Levers are highly
vulnerable to fraud. Like touch screens, they don’t produce a verifiable paper
record. NY votes exclusively on Levers; the WPE was 11.4%. CT, another heavy
Lever state, had the second highest WPE (15.7%) of all the states. NY was
number four.
36- Polling data
was cherry-picked and assumptions set to favor Kerry. But no assumptions were made in the following four
models which used three different sets of exit poll data which included response rates and within
precinct error (WPE) provided by exit pollsters Edison-Mitofsky. And they all
produced equivalent results. The Optimizer confirmed the USCV simulation of
1250 precincts categorized by partisanship which debunked the reluctant Bush
responder (rBr) hypothesis.
a-The Exit Poll
Response Optimizer model was applied to 1250 precincts categorized in five partisanship groups: Strong Bush,
Bush, Even, Kerry, Strong Kerry. The
2-party result: Kerry 52.15-Bush 47.85%.
b-The Optimizer was
applied to five location-size
categories (Big Cities, Small Cities, Suburban, Small Towns, Rural) :
52.15-47.85%
c) The Optimizer was
applied to all the states: 52.3-47.7%
d) The 12:22am
National Exit Poll “Voted in 2000” demographic: 51.9-48.1%