Super Tuesday: Strange Obama to Clinton Exit Poll Shift
TruthIsAll Updated 2/13/08
Was it New Hampshire all over again?
Just like the 2004 Bush exit poll red-shift, there was a Super Tuesday Hillary-shift from 14 of 16 exit polls to the recorded vote.
The Exit Polls
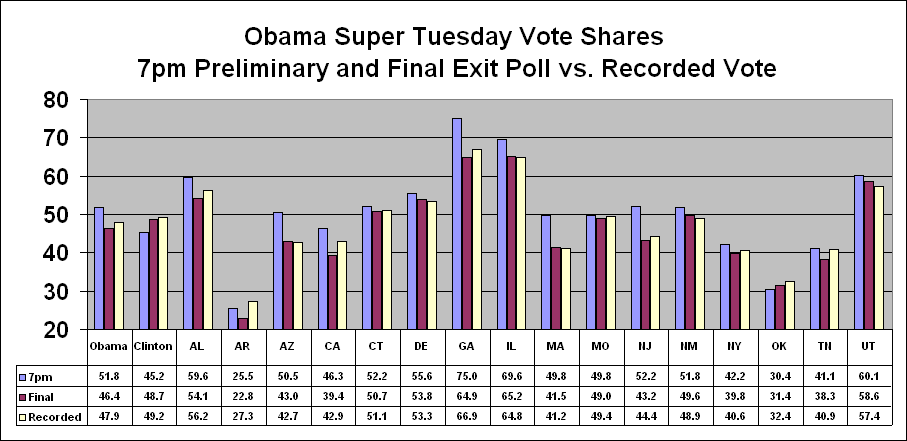
Obama led the 7pm exit polls aggregate vote share by 51.8-45.2%.
He was leading in 11 states.
The final exit poll aggregate vote share flipped to Clinton:
48.7-46.4%.
Obama’s lead was reduced to 7 states.
Fifteen states shifted to Clinton from the 7pm update to the final exit polls.
As usual, the finals were forced to match the recorded votes.
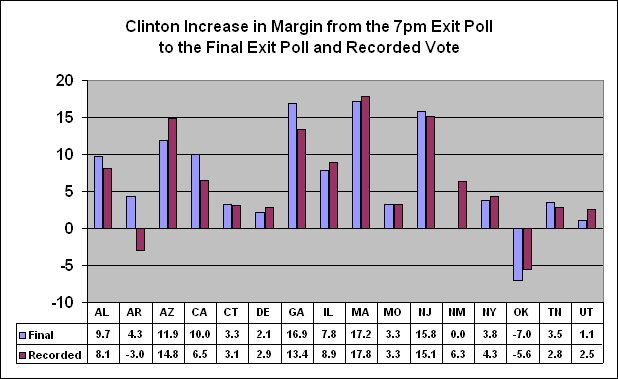
7PM Exit Poll to Recorded Vote Shift
Clinton won the final recorded vote: 49.2-47.9%, an 8% increase in margin from the 7pm aggregate.
Fourteen states shifted to Clinton from the unadjusted 7pm exit polls to the recorded vote.
Arkansas and Oklahoma shifted slightly to Obama. Clinton easily won both - by 42% and 24%, respectively.
Obama won 7 of the 16 states (New Mexico is a virtual tie and will be recounted).
The margin of error was exceeded in 7 states - all in favor of Clinton
Arizona: Obama led by 6%; he lost by 9%.
Massachusetts: Obama led by 3%; he lost by 15%.
New Jersey: Obama led by 5%; he lost by 10%.
Alabama: Obama led by 23%; he won by 13%.
California: Clinton led by 3%; she won by 10%.
Georgia: Obama led by 49%; he won by 36%
Illinois: Obama led by 41%; he won by 32%
The largest Clinton vote shifts were in Competitive and Strong Obama states
Note the states where Clinton's vote share sharply increased .
In some states, extra delegates are awarded if the winner’s vote share exceeds a given percentage.
Strong Obama states: AL, DE, GA, IL, UT
Obama led the exit polls by 39%. He won all 5.
But his vote margin declined sharply (- 12%) from 7pm to the recorded 27%.
The vote shift exceeded the margin of error for Clinton in 3 states.
Strong Clinton states: AR, NY, OK, TN
Clinton led the polls by 18%. She won all 4.
Her vote margin rose slightly (2%) from 7pm to the recorded 20%.
Competitive states: AZ, CA, CT, MA, MO, NJ, NM
Obama led the polls by 0.7%. He was leading in every state except CA.
But Clinton won 4 of the 7 states (NM is still undecided).
Her vote margin increased sharply (9.4%) from 7pm to the recorded 8.7%.
The vote shift exceeded the margin of error for Clinton in 4 states.
The Probability is...
One in 40 (.025) that the exit poll discrepancy in favor of Clinton would exceed the margin of error in any given state.
One in 22,000 that the aggregate vote share would exceed the 7pm exit poll share by 4% (2.0% MoE).
=1 / NORMDIST (.4518, 4918, 2.0/1.96, TRUE)
One in 17 million that the vote share discrepancy would exceed the margin of error in at least 7 of 16 states.
=1 / (1-BINOMDIST (6, 16, 0.025, TRUE))
|
|
|
7PM |
|
|
|
|
Final |
|
|
Recorded |
|
|
|
|
|
|
MoE |
Obama |
Clinton |
Margin |
|
Obama |
Clinton |
Margin |
|
Obama |
Clinton |
Margin |
Chg7pm |
>MoE |
|
WtdAvg |
2.77 |
51.8 |
45.2 |
6.6 |
|
46.4 |
48.7 |
-2.3 |
|
47.9 |
49.2 |
-1.3 |
-8.0 |
7 |
|
|
|
|
|
|
|
|
|
|
|
|
|
|
|
|
|
AL |
3.2 |
59.6 |
37.0 |
22.6 |
|
54.1 |
41.2 |
12.9 |
|
56.2 |
41.8 |
14.5 |
-8.1 |
yes |
|
AR |
3.1 |
25.5 |
71.2 |
-45.7 |
|
22.8 |
72.8 |
-50.0 |
|
27.3 |
70.0 |
-42.7 |
3.0 |
|
|
AZ |
2.9 |
50.5 |
44.8 |
5.7 |
|
43.0 |
49.2 |
-6.2 |
|
42.7 |
51.8 |
-9.1 |
-14.8 |
yes |
|
CA |
2.3 |
46.3 |
49.6 |
-3.3 |
|
39.4 |
52.7 |
-13.3 |
|
42.9 |
52.8 |
-9.8 |
-6.5 |
yes |
|
CT |
2.9 |
52.2 |
45.0 |
7.2 |
|
50.7 |
46.9 |
3.9 |
|
51.1 |
47.0 |
4.1 |
-3.1 |
|
|
DE |
3.7 |
55.6 |
41.9 |
13.7 |
|
53.8 |
42.2 |
11.6 |
|
53.3 |
42.5 |
10.8 |
-2.9 |
|
|
GA |
3.0 |
74.5 |
25.5 |
49.0 |
|
64.9 |
32.8 |
32.1 |
|
66.9 |
31.4 |
35.6 |
-13.4 |
yes |
|
IL |
2.9 |
69.6 |
29.1 |
40.5 |
|
65.2 |
32.5 |
32.7 |
|
64.8 |
33.2 |
31.6 |
-8.9 |
yes |
|
MA |
2.7 |
49.8 |
47.3 |
2.5 |
|
41.5 |
56.1 |
-14.7 |
|
41.2 |
56.6 |
-15.3 |
-17.8 |
yes |
|
MO |
3.1 |
49.8 |
45.1 |
4.7 |
|
49.0 |
47.6 |
1.4 |
|
49.4 |
48.0 |
1.4 |
-3.3 |
|
|
NJ |
2.7 |
52.2 |
47.0 |
5.2 |
|
43.2 |
53.8 |
-10.6 |
|
44.4 |
54.3 |
-9.9 |
-15.1 |
yes |
|
NM |
3.3 |
51.8 |
45.6 |
6.2 |
|
49.6 |
43.5 |
6.2 |
|
48.9 |
49.0 |
-0.1 |
-6.3 |
|
|
NY |
2.7 |
42.2 |
55.6 |
-13.4 |
|
39.8 |
57.0 |
-17.2 |
|
40.6 |
58.3 |
-17.7 |
-4.3 |
|
|
OK |
4.6 |
30.4 |
60.5 |
-30.1 |
|
31.4 |
54.5 |
-23.1 |
|
32.4 |
56.9 |
-24.5 |
5.6 |
|
|
TN |
2.7 |
41.1 |
51.6 |
-10.5 |
|
38.3 |
52.3 |
-14.0 |
|
40.9 |
54.1 |
-13.3 |
-2.8 |
|
|
UT |
4.8 |
60.1 |
39.9 |
20.2 |
|
58.6 |
39.5 |
19.1 |
|
57.4 |
39.7 |
17.7 |
-2.5 |
|
Probability of Deviations from the 7pm Exit Poll to Recorded Vote
Primary Margin Obama Prob. Clinton Prob.
State of Error Dev 1 in Dev 1 in Total 2.00 -3.96 19463 4.00 22214
AL 3.15 -3.4 54 4.8 670
AR 3.09 1.8 1.1 -1.2 1.3 AZ 2.85 -7.8 24 mil 7.0 1.4 mil CA 2.26 -3.4 602 3.2 320 CT 2.86 -1.1 4 2.0 13 DE 3.73 -2.3 9 0.6 2.6 GA 3.01 -8.1 13 mil 5.4 4081 IL 2.95 -4.8 1282 4.1 315 MA 2.65 -8.6 8 bil 9.3 251 bil MO 3.09 -0.4 3 2.9 30 NJ 2.72 -7.8 116 mil 7.3 15 mil NM 3.26 -2.9 25 3.4 49 NY 2.66 -1.6 9 2.7 44 OK 4.65 2.0 1.2 -3.6 1.1 TN 2.69 -0.2 2.3 2.5 31 UT 4.84 -2.7 7 -0.2 1.9
Gender Demographic Vote
Shares
7pm Exit Polls 11pm CNN Final
Mix HRC JE BO
AL Male 41% 40% 3% 57%
966 HRC BO Fem 59% 42% 2% 52%
resp. 37 60 41.2% 2.4% 54.1%
AR
Male 40% 68% 1% 27%
1008 HRC BO Fem 60% 76% 3% 20%
71 25 72.8% 2.2% 22.8%
AZ Male 38% 43% 6% 48%
1182 Fem 62% 53% 5% 40%
45 51 49.2% 5.4% 43.0%
CA Male 45% 45% 6% 46%
1879 Fem 55% 59% 6% 34%
46 50 52.7% 6.0% 39.4%
CT Male 41% 38% 1% 59%
1178 Fem 59% 53% 1% 45%
45 52 46.9% 1.0% 50.7%
DE Male 40% 38% 4% 58%
690 Fem 60% 45% 2% 51%
42 56 42.2% 2.8% 53.8%
GA Male 37% 29% 3% 68%
1060 Fem 63% 35% 1% 63%
26 75 32.8% 1.7% 64.9%
IL Male 42% 29% 3% 67%
1107 Fem 58% 35% 1% 64%
29 70 32.5% 1.8% 65.2%
MA Male 42% 48% 1% 49%
1365 Fem 58% 62% 1% 36%
47 50 56.1% 1.0% 41.5%
MO Male 44% 47% 2% 49%
1005 Fem 56% 48% 2% 49%
45 50 47.6% 2% 49%
NJ Male 42% 48% 1% 49%
1298 Fem 58% 58% 2% 39%
47 52 53.8% 1.6% 43.2%
NM Male 44% 39% 2% 53%
905 Fem 56% 47% 1% 47%
46 52 43.5% 1.4% 49.6%
NY Male 42% 50% 2% 45%
1361 Fem 58% 62% 1% 36%
56 42 57.0% 1.4% 39.8%
OK Male 47% 55% 9% 33%
445 Fem 53% 54% 11% 30%
61 30 54.5% 10.1% 31.4%
TN Male 41% 47% 8% 43%
1326 Fem 59% 56% 4% 35%
52 41 52.3% 5.6% 38.3%
UT Male 43% 27% 1% 70%
410 Fem 57% 49% 1% 50%
40 60 39.5% 1.0% 58.6%